By now, if you’ve been paying attention to the coverage following the April employment report, you know the following:
- The March to April decline in the unemployment rate from 8.2 percent to 8.1 percent was arithmetically driven by yet another decline in the labor force participation rate (LFPR).
- The decline in the LFPR, now at its lowest level since the early 1980s, is itself being influenced by a confounding mix of demographic change and other behavioral changes that nobody seems to understand—a point emphasized by a gaggle of blogs and bloggers such as Brad DeLong, Carpe Diem, Conversable Economist, Free Exchange, and Rortybomb, to name a few.
With respect to the first observation, in a previous post my colleague Julie Hotchkiss described how to use our Jobs Calculator to get a ballpark sense of what the unemployment rate would have been had the LFPR not changed. If you follow those procedures and assume that the LFPR had stayed at the March level of 63.8 percent instead of falling to 63.6 percent, the unemployment rate would have risen to 8.4 percent instead of falling to 8.1 percent.
It is clear that interpreting this sort of counterfactual experiment depends critically on how you think about the decline in the LFPR. The aforementioned post at Rortybomb cites two Federal Reserve studies—from the Chicago Fed and the Kansas City Fed—that attempt to disentangle the change in the LFPR that can be explained by trends in the age and composition of the labor force. These changes are presumably permanent and have little to do with questions of whether the labor market is performing up to snuff.
The following chart, which throws our own estimates into the mix, illustrates the evolution of the actual LFPR along with an estimate of the LFPR adjusted for demographic changes:

As the header on the chart indicates, our estimates suggest that roughly 40 percent of the change in the LFPR since 2000 can be accounted for by changes in age and composition of the population—in essentially the same range as the Chicago and Kansas City Fed studies. (If you are interested in the technical details you can find a description of the methodology used to generate the chart above, based on work by the University of Chicago’s Rob Shimer.
In other words, 0.9 percentage points of the decline in the LFPR since the beginning of the past recession can be explained by demographic trends (as the baby boomers age, the labor force will grow more slowly than the total population [ages 16 and up]). Subtracting the demographic trends still leaves 1.5 percentage points to be explained, a number right in line with Brad DeLong’s back-of-the-envelope calculation of “cyclical” LFPR change.
As DeLong’s comments make clear, the interpretation of the nondemographic piece of the LFPR change requires, well, interpretation. And the consequences of connecting the dots between changes in the unemployment rate and broader labor market performance are enormous.
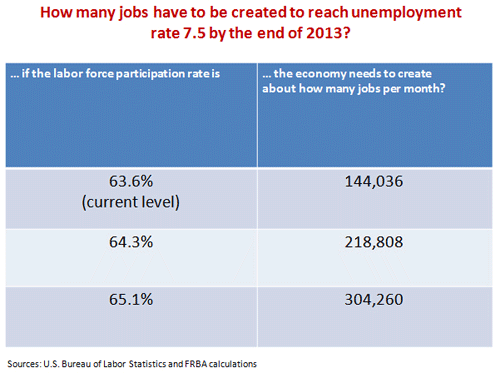
In the recently released Summary of Economic Projections following the last meeting of the Federal Reserve’s Federal Open Market Committee, the midpoint of the projections for the unemployment rate at the end of 2013 is 7.5 percent. Turning again to our Jobs Calculator, we can get a sense of what sort of job creation over the next 20 months will be required given different values of the LFPR. For these estimates, I consider three alternatives: The LFPR stays at its April level, the LFPR reverts to our current estimate of the demographically adjusted level (that is, increases by 1.5 percentage points), and an intermediate case in which the LFPR increases by 0.7 percentage points—the lower end of DeLong’s estimate of “people who really ought to be in the labor force right now, but who are not.”
DeLong asks:
“Are [people who really ought to be in the labor force right now, but who are not] now part of the ‘structurally’ non-employed who we will never see back at work, barring a high-pressure economy of a kind we see at most once in a generation?”
As you can see, the answer to that question matters a lot to how we should think about progress on the unemployment rate going forward.


Leave a Reply