The yield curve has shifted up and steepened over the last 4 months, which I read as a perception that things are not quite as dreary as they appeared a short while ago.
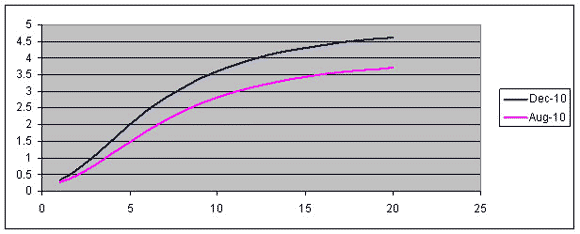
Yield curve on Dec. 21 and Aug. 20, 2010. Horizontal axis: maturity in years. Vertical axis: yield on zero-coupon bond for that maturity. Constructed using methods developed by Gurkaynak, Sack and Wright, Journal of Monetary Economics, Nov. 2007; working paper version here; data set updated continuously here.
On the other hand, that still leaves the overall level of interest rates a little below where they stood a year ago. Essentially what happened this fall was a reversal of much of the pessimistic sentiment that had been developing in the first 8 months of 2010.
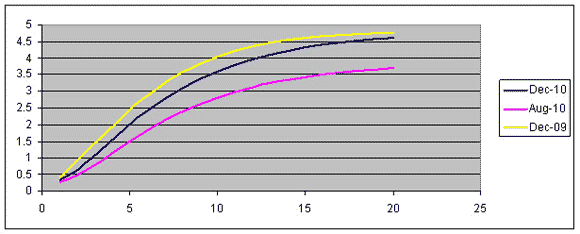
Yield curve on Dec. 21, 2010, Aug. 20, 2010, and Dec. 21, 2009.
Much of the flattening and lowering of the yield curve in the first 8 months of 2010 was due to a decrease in inflationary expectations. These too have come back up, as the graph below of the spread between nominal yields and those on Treasury inflation protected securities reveals.
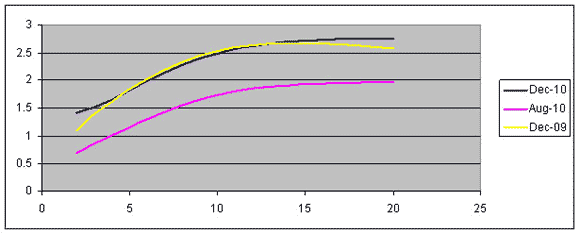
Break-even inflation rate as a function of maturity on Dec. 21, 2010, Aug. 20, 2010, and Dec. 21, 2009. Constructed using methods developed by Gurkaynak, Sack and Wright, American Economic Journal: Macroeconomics, Jan. 2010; working paper version here; data set updated continuously here.
Note that since the nominal rates are below the levels of a year ago while expected inflation rates are back where they were, this means that real interest rates have come down. And although the inflation rates implied by the above curve for the next 5 years remain a bit below what the Fed would ideally aim for, this is a better picture than Bernanke was looking at last August.
One goal of the Fed’s second round of quantitative easing begun at the start of November was to flatten the yield curve. That obviously didn’t happen, and I discussed some of the reasons why a few weeks ago. A second goal was to increase inflationary expectations, which was achieved.
Even so, all we’ve done is moved back to about where we were a year ago. And a year ago, if you recall, things really weren’t that great.
But at least now we’re moving in the right direction.

Leave a Reply