“Homeownership Bubble” Continues to Deflate

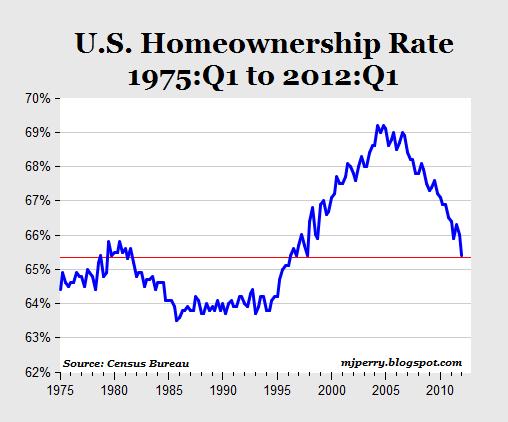
The homeownership rate in the U.S. fell in the first quarter of 2012 to 65.4% (see chart below), according to data released today by the Census Bureau. That was the lowest homeownership rate in 16 years, since the 65.1% rate in the first quarter of 1996, and it looks like it will probably continue falling in the future.

Conclusion: The political obsession with homeownership starting in the mid-1990s raised the homeownership rate from below 64% in 1994 to an artificial level above 69% by 2004, but failed in the long run to create a homeownership rate that was sustainable in the long run. In the process, government policy turned good renters into bad homeowners, created a housing bubble, waves of foreclosures, and a subsequent housing meltdown and financial crisis. In other words, the chart illustrates how government policies (monetary, mortgage market, GSEs, CRA, affordable housing, etc.) created an unsustainable “homeownership bubble” that continues to deflate.

Disclaimer: This page contains affiliate links. If you choose to make a purchase after clicking a link, we may receive a commission at no additional cost to you. Thank you for your support!

About Mark J. Perry 262 Articles

Affiliation: University of Michigan

Dr. Mark J. Perry is a professor of economics and finance in the School of Management at the Flint campus of the University of Michigan.

He holds two graduate degrees in economics (M.A. and Ph.D.) from George Mason University in Washington, D.C. and an MBA degree in finance from the Curtis L. Carlson School of Management at the University of Minnesota.

Since 1997, Professor Perry has been a member of the Board of Scholars for the Mackinac Center for Public Policy, a nonpartisan research and public policy institute in Michigan.

Visit: Carpe Diem

Be the first to comment

Leave a Reply

Your email address will not be published.


*

This site uses Akismet to reduce spam. Learn how your comment data is processed.