Goldwatchers were reminded gold’s volatility works in both directions this week, with prices falling more than $100 an ounce in just one day. We forecasted the selloff last week, explaining a 10 percent correction would be a non-event. Once again the CME Group hiked the exchange’s margin requirements for gold investment to shake out overleveraged speculation. This is a positive for long-term investors.
One market trend that seems to be attracting more and more attention is the large performance gap between gold bullion and gold stocks. The price of gold bullion has increased roughly 28 percent in 2011, while the S&P/TSX Gold Index was down 1 percent as of Monday. This shouldn’t come as news for subscribers to these weekly alerts; we first discussed this opportunity back on June 17: Will Gold Equity Investors Strike Gold?
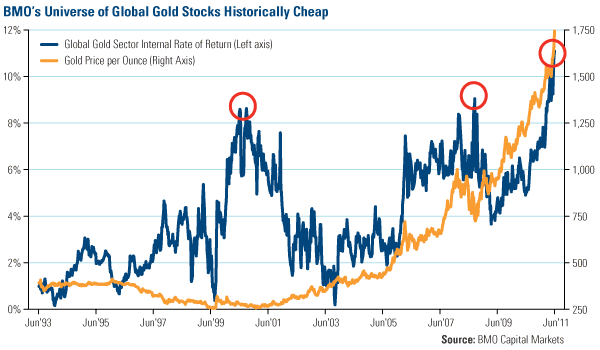
A report this week from BMO Capital Markets offered one reason behind the performance gap, “The rate of change in the gold price has been high over the past decade, perhaps too high for investors to gain confidence in that price as sustainable for an equity investment decision.” BMO says it was hard to imagine gold prices could sustain a $1,000 an ounce levels five years ago, but “now it’s hard to see the gold price falling to that level.”
Using the implied value of a defined group of global gold stocks, it calculated the internal rate of return to measure how gold stocks have underperformed compared to the yellow metal. Over a period of nearly 20 years, BMO’s group of global gold stocks has never been this inexpensive. Only twice—during the Tech bubble in 2000 and the financial crisis of 2008—has the internal rate of return compared so closely with the price of gold bullion.
RBC Capital Markets also sees potential in unpopular, undervalued gold equities and urged readers to take “a fresh look” at gold companies in a report this week. RBC says gold companies currently have margins that are at record highs and it believes margins could be approximately $1,200 an ounce for the next 12 to 24 months. This is substantially higher than the 10-year average of $320 an ounce. Comparatively, many current projects were economically sound at $700-$1,000 per ounce gold prices, creating $300-500 an ounce margins.
Right now, BMO calculates the total cost to produce an ounce of gold at roughly $900 an ounce, while the company can turn around and sell that ounce for upwards of $1,400. This puts margins near 40 percent, roughly twice what they were in 2007 and four times higher than in 2000.
Increased profit margins put more money in gold company coffers and this is reflected in the unprecedented amount of free cash flow (FCF), RBC says. The firm says the industry has reached an inflection point with a “substantial wave of free cash flow” coming over the next 1 to 2 years.
You can see this incredible increase in Tier 1 producers, such as Barrick, Goldcorp, Kinross and Newmont Mining. Looking at their trailing 12 months of free cash flow over 10 years, FCF never rose above $2 billion. However, following the trend in gold prices, FCF among these Tier 1 companies stair-stepped up to $4 billion.
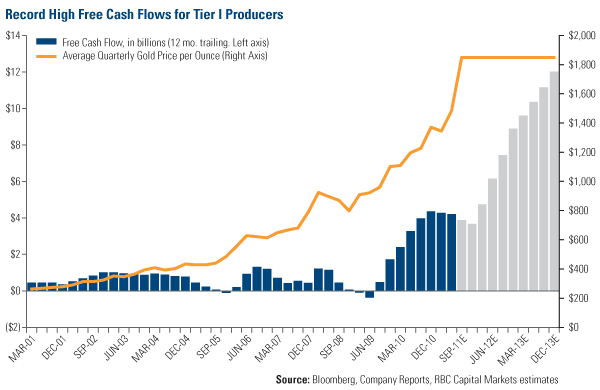
Looking forward over the next few years, RBC estimates that if the price of gold remains at $1,850, FCF should stair-step even further, reaching nearly $12,000 by the end of December 2013. BMO estimates the global gold companies will accumulate net cash of $120 billion by 2015 if gold prices remain elevated.
Rising FCF is especially relevant to shareholders, as it allows the gold company to use that money to invest in projects that should enhance shareholder value. This could include pursuing new projects, making acquisitions, reducing debt or paying dividends. Many gold companies are opting for the latter and increasing dividends but these increases haven’t kept up with the pace of rising earnings. The average payout ratio was roughly 20 percent in 2008 but currently sits around 10 percent in 2011.
BMO says, “A dividend policy linked to the financial performance of the company offers investors additional leverage to the gold price. The provision of a meaningful and sustained dividend has the potential to broaden investor appeal and to instill fiscal responsibility for management.” I’ve often echoed similar sentiments.
BMO says gold stocks are currently trading at historically cheap levels, which the company sees as an opportunity investors can take advantage of. RBC attempts to quantify that opportunity by saying “if gold prices remain elevated and/or investors accept a higher long-term gold price, we could see 25-50 percent upside in equities.”
How to Pick Gold Miners
With gold miners, in general, so attractively valued relative to the gold bullion price, the question becomes: Which stocks are the most compelling and have the best leverage to robust precious metals prices?
First, an investor could begin the process through elimination. FINRA highlighted some of the key warning signs when analyzing gold stocks, such as claims of being a “buyout target,” or speculative claims about reserve growth, and grandiose predictions of exponential growth, to name a few. FINRA says investors should be wary of “free lunch” programs that claim profits in gold are “easy,” and we agree.
Research from geologist Robert Sibthorpe shows that only one in 2,000 (0.05 percent) companies would ever find 1 million ounces of gold, and that only a third of those would be able to turn that find into production. In addition, research from Barry Cooper at CIBC shows that these discoveries are becoming even more difficult. There were 51 gold/copper porphyry discoveries of +3 million ounces during the 1990s, but only 24 of such discoveries occurred during the 2000s.
In order to find the diamonds in the rough, I use what I call “The Five M’s” for mining stocks. I discussed this process thoroughly in The Goldwatcher: Demystifying Gold Investing, an investor’s guidebook to gold investing I co-authored with John Katz a couple of years ago.
The Five M’s are: Market cap, Management, Money, Minerals and Mine life cycle.
1) Market Cap
Market cap is simply the number of shares outstanding multiplied by the stock price. The gold sector is broken down into three sectors by market cap: Seniors (market caps >$10 billion), intermediates (between $2 and $10 billion) and juniors (<$2 billion).
If a gold company has 10 million shares outstanding at $1 per share, the company is valued at $10 million. The question any investor should ask is, “Is this company really worth $10 million?” If the market pays $25 per ounce of gold in the ground, the company should be valued at $25 million (1 million ounces in reserves X $25 an ounce). If the company’s market cap is only $10 million, it may look undervalued. Accordingly, if the company’s market cap is $50 million, it may appear to be overvalued.
For larger gold companies, an investor can measure a company’s market cap against its production level, reserve assets, geographic location and/or other metrics to establish relative valuation. For junior mining companies—an area of focus for our World Precious Minerals Fund (UNWPX)—we look for balance sheets with ample cash for exploration and development of prospective reserves, but we resist paying more than two times cash per share.
2) Management
Essentially, management of mining companies must have both explicit and tacit knowledge to be successful. Explicit knowledge is academic. How many PhDs or masters in geology/engineering does company management have?
Tacit knowledge is more personal in nature and much more difficult to obtain. It is acquired over time through first-hand observation, experience and practice. How many years have they worked in the industry? Has management ever successfully completed a project with similar geopolitical/environmental constraints?
Success in the mining sector, especially the juniors, relies on the ability to raise capital and communicate with investors. Often the heads of junior companies are geologists or engineers who have no relationships in the brokerage business. This lack of relationships impedes their ability to generate market support. Historically, companies with the highest number of retail shareholders have the highest price-to-book ratios and carry higher valuations than peers.
Some of the most successful company builders in the gold-mining industry are what I call the “financial engineers” – people who have the relationships and understand the capital markets and who know how to hire the best geological and engineering teams. We tend to have more confidence investing in them.
3) Money
Mining is an expensive business. Often, companies burn through substantial amounts of capital before generating their first $1 in cash flow. A gold exploration company has to deliver reserves per share to have a chance at another round of financing. It has to convince the capital markets that it is an attractive investment on a per-share basis.
We call this the “burn rate”—how long will the company’s current cash levels last before it has to return for additional financing. If a junior exploration company has $15 million in cash reserves and is spending $3 million a month, it has five months to deliver enough reserves per share to convince capital markets it is worth the risk.
This calculation can be done quickly. Exploration reserves are generally valued at one-third the reserve values of a producing mine—if producing reserves are valued at $150 an ounce, exploration reserves would be $50 per ounce.
The gold-equities market is generally efficient at judging reserves per share, so if the exploration company doesn’t come up with the results necessary to get an evaluation—find gold for less than $50 an ounce—investors quickly lose confidence. There is an old rule when it comes to exploration companies: don’t pay more than two times cash per share if there are no proven assets in the ground.
4) Minerals
Compared to the rest of the mining sector, gold companies have the highest industry valuations based on price to earnings, price to cash flow, price to enterprise value and price to reserves per share.
Companies operating mines that produce gold as well as industrial metals tend to have lower valuation multiples. For example, the current price-to-earnings ratio for Freeport-McMoRan (FCX), is 8x-times forward earnings. This is considerably lower than Yamana (20x), Goldcorp (21x) and Agnico-Eagle (36x). Investors can use the low relative valuations of copper/gold producers to increase their margin of safety in anticipation of an upward move in gold prices.
5) Mine Lifecycle
There are many delays and disappointments during the development and operation of a gold mine. Input costs can rise out of control (such as what happened in 2008 when oil hit $140 per barrel), labor workers can strike, and political/environmental policy shifts such as higher taxes or stricter environmental regulations can shrink margins.
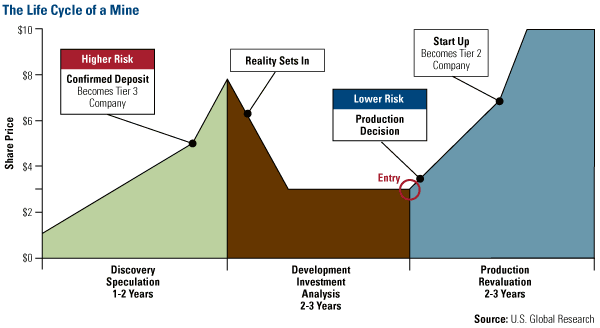
During the exploration and development phase, the price of a gold stock often follows a course that ends up looking like a double-humped camel (see graphic). First there’s euphoria over exploration results that are better than expected. The stock price rises as investors race to buy shares. Then reality sets in – this gold discovery is still years away from being an actual producing mine. At this point, there’s a huge correction in the stock price.
Assuming the company continues down the path to development, its share price drifts sideways until around six months before the first ounce of gold is expected to be produced. At this point, the stock begins a strong new leg up when a more sophisticated set of shareholders come into the market. Eventually the price drops off and then levels as the speculative money moves on to the next hot opportunity and the company transitions from explorer to producer.
U.S. Global’s Expertise
Clearly, the task of picking which gold miners to invest in isn’t easy. We actively travel to mining projects in places such as Colombia, Panama and West Africa to “kick the tires” and ask tough questions of management. This is the value that our investment team at U.S. Global Investors provides for our shareholders and how we seek to generate alpha.

Leave a Reply