Our thoughts and prayers are with the people of Japan. The videos, images and stories of the devastation caused by last week’s earthquake and tsunami have touched our hearts and rattled investor psyches around the world.
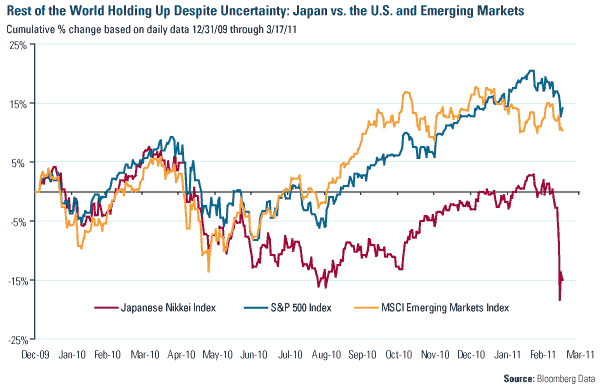
The threat of disaster from the damaged Fukushima nuclear power plant unleashed a ferocious sell-off of Japanese equities, but the damage to other major markets has been limited. Already experiencing a slight pullback prior to the events on March 11, U.S. equities and emerging markets have held up quite well. The MSCI Emerging Markets Index has only pulled back 2 percent since the earthquake and the S&P 500 Index only 3 percent.
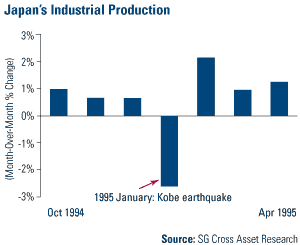
Japan has experienced similar disasters before on a smaller scale. In 1995, the Great Hanshin Earthquake severely damaged the port city of Kobe, killing more than 6,000 people. Japanese industrial production (IP) fell by 2.6 percent during the January following the earthquake, according to Societe Generale analyst Takuji Okubo. However, that drop-off was short lived. Okubo reports that IP sprang up 2.2 percent the following month and 1 percent during March.
 Goldman Sachs estimates that the total cost of damage from the March 11 earthquake will be $198 billion—roughly 1.6 times that of the Great Hanshin earthquake. That works out to roughly 4 percent of GDP. However, Martin Wolf from the Financial Times points out that as of March 17, Japan has lost $344 billion worth of market cap since March 11, equaling nearly 7 percent of the country’s GDP.
Why have investors reacted this way? Investor anxiety and the selloff have been exacerbated by two trends which have plagued Wall Street over the past few years: The excessive use of Value-at-Risk (VAR) models and a risk-averse herd mentality.
The VAR Model is used by investment firms and others to measure the market risk of their asset portfolios by calculating the probability of maximum loss given a certain time period, i.e. “how much could I lose in a really bad day (month)?”
VAR models have three different components: A time period (generally a day or a month), a level of confidence (generally 95 or 99 percent confidence level) and an estimate of investment loss. There are three mathematical models used to calculate VARs: Variance-Covariance, historical simulation and Monte Carlo Simulation. (Editor’s note: For an in-depth explanation of these concepts, see Investopedia and HedgeFund-Index).
All of the major investment firms have a risk management officer who uses some form of a VAR model. Their biggest concern is the daily, weekly, and monthly volatility. There’s a certain level of volatility that financial institutions can’t stomach because they are leveraged themselves.
It’s similar to the freezing point when water turns to ice. Once this level is reached, the risk management officers give portfolio and money managers a “tap on the shoulder” to reduce risk and raise cash levels. Since risk managers all over the world are using very similar models, it creates a herd mentality and stock sales all get triggered at the same time. Similar herd mentalities and groupthink have led to some of history’s most infamous financial calamities such as the crash of 1987 and 2008 after the fall of Lehman Brothers.
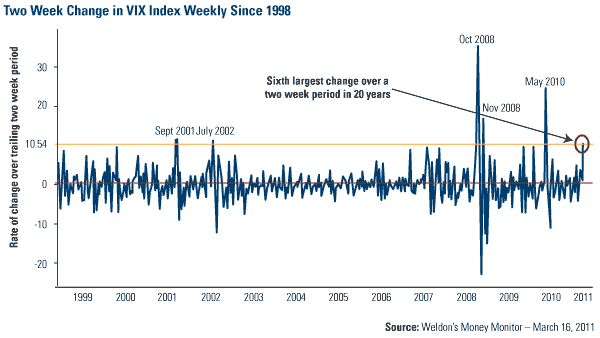
The VAR herd mentality shows up in the volatility index, or VIX, which is a measure of stress in the system. Currently, it’s a combination of forces (the ongoing turmoil in the Middle East and North Africa and Japan’s natural disaster) that is injecting stress into the system. The VIX pushed toward the 30 level this week, a level that has historically been associated with “extreme market turbulence.” As of mid-week, the two-week change in the VIX represented the sixth largest move in the past 20 years, according to Greg Weldon.
Once stability returns and a new equilibrium is found, the VIX then falls and the risk management officer allows the money managers to invest again.
Periods of high volatility and uncertainty generally cause investors to head for cover and liquidate assets but we think investors should do the opposite—classic contrarian thinking.
A prime example occurred two years ago. On March 18, 2009, we highlighted for investors in a special alert that a shift in government policy—an amended FASB-157 “mark to market” rule, a change to the short sell (uptick) rule and a $300 billion liquidity injection from the Federal Reserve—meant a strong wind was hitting the market’s sails and was likely to cause a massive price reversal. We were confident of this shift because these events fit into one of our core tenants of our investment process—that government policies are precursors to change.
Two years later, large growth funds, large value funds and world stock funds have all risen 40 percent or more, according to Morningstar. Some asset classes such as midcaps and natural resources stocks have doubled off of their lows but are still working to regain previous highs.
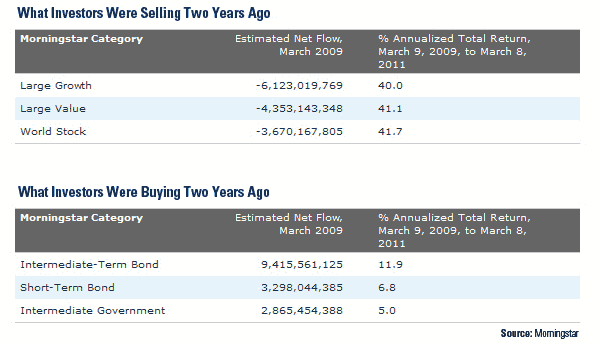
Unfortunately, instead of buying into the opportunity, more than $25 billion was pulled out of domestic and international stock funds while $22 billion flowed into bond funds, such as intermediate-term, short-term and intermediate government bond funds. The returns on those asset classes over the same March 2009 to March 2011 period were 11.9, 6.8 and 5 percent, respectively.
Another example is last year’s explosion of the Macondo Well in the Gulf of Mexico. Many investors dumped their investments in British Petroleum because of the regulatory uncertainty and growing costs of the cleanup, but BP’s stock has recovered more than 67 percent since its June 2010 lows.
The key difference between the events of two years ago and today is that natural disasters tend to cause great short-term anxiety but have minimal lasting effect, while shifts in government policy are generally precursors to significant change. BCA says that “natural disasters rarely change an economy’s growth trajectory and this earthquake should be no exception.” They continue to say that “the earnings picture of the Japanese corporate sector is unlikely to be significantly affected by this natural disaster.”
In fact, the total impact of the earthquake on Japan’s economy is likely to amount to 0.5 percent of GDP, not even comparable to the global credit crisis that reduced Japan’s GDP by 10 percent between the first quarters of 2008 and 2009, according to the Financial Times.
In America, following Hurricane Katrina, we saw that there are basically six to 15 weeks of misery before the rebuilding begins. Estimates show Japan will spend $500 billion to rebuild its economy and given the government’s long history of investing in the country’s infrastructure, we expect they will waste no time in rebuilding and repairing. Reconstruction spending will probably kick in some time during the second quarter, supporting the country’s growth rate, according to BCA.
We are also seeing nuclear projects being pushed back until engineers from around the globe can learn from this tragedy. This makes coal, natural gas and crude oil more attractive in terms of near-term demand.
A final variable to consider is the immense patriotism and pride inherent in Japanese culture. In his Financial Times column, Martin Wolf says “if any civilization is inured to such tragedies it is Japan’s. Its people will cope. This seems certain.” Japanese culture has a very strong family unit with high savings rates. If the picture of the family above is any indication, this strong culture of family will help them endure, adapt and move forward.
Director of Research John Derrick contributed to this commentary.


Leave a Reply