The major market indices were under pressure yesterday with bearish price action across a host of individual names. Although the bearish action is accompanied by high volume, the markets are still in a volatile range. Below is a long idea in V.F. Corporation (VFC), and a short opportunity in Autodesk, Inc. (ADSK).
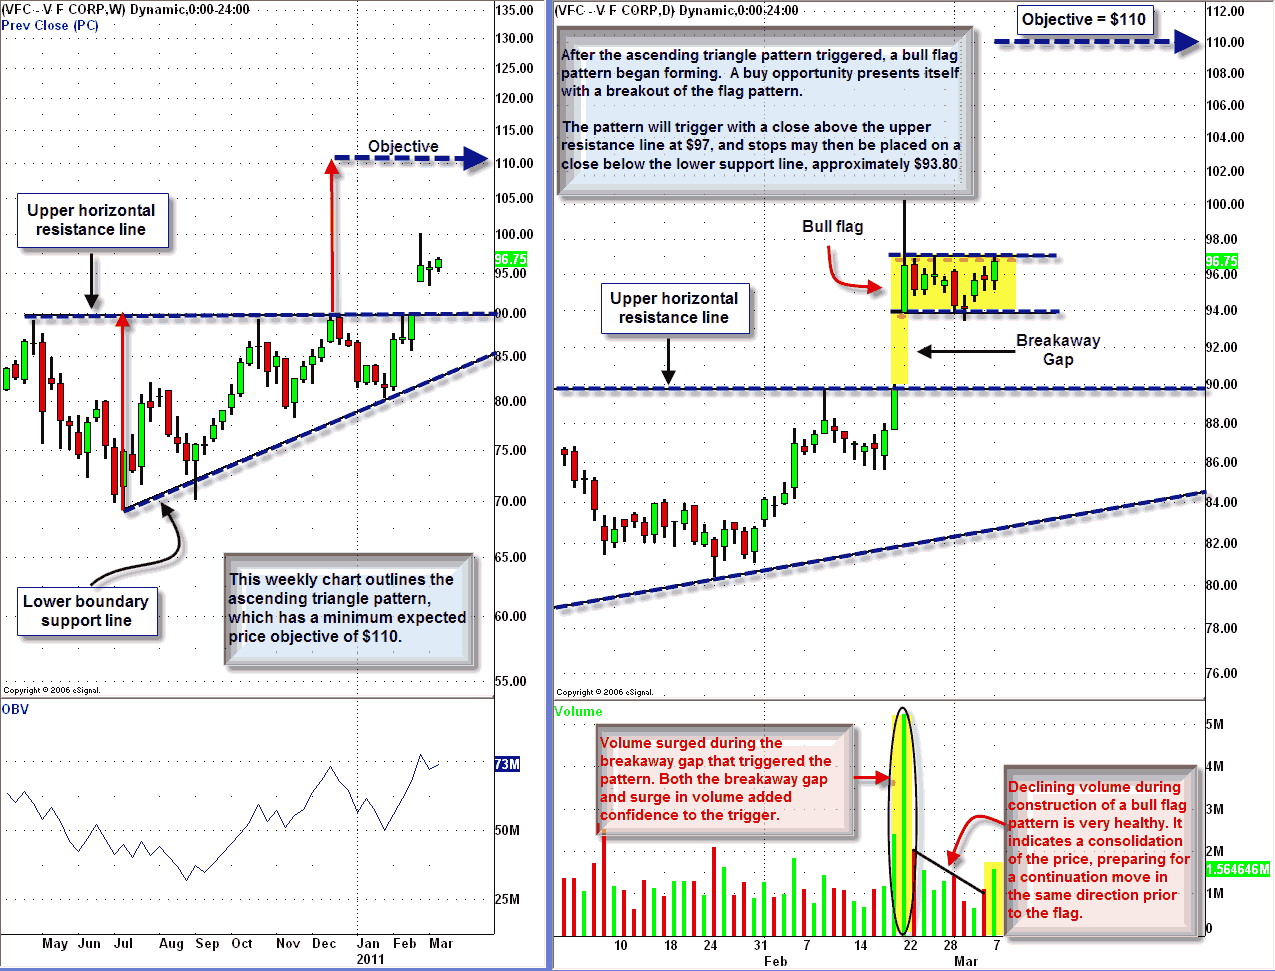
Chart 1: VFC: The left chart below is a weekly chart illustrating an ascending triangle pattern, which triggered on February 22nd. The large breakaway gap that triggered the pattern was the result of favorable earnings. Minimum expected price objective is $110, obtained by measuring the height of the pattern and expanding higher by the same distance from the trigger point.
The daily chart on the right illustrates the breakaway gap that triggered the macro pattern. Shortly after the breakout a bull flag pattern began forming, which is highlighted. A buy opportunity presents itself with a breakout of the flag pattern. Trigger: daily close above flag resistance at $97. Increase of volume on trigger is important. Target: $110, Protective stop: daily close below support of the pattern, approximately $93.80.
(click to enlarge)
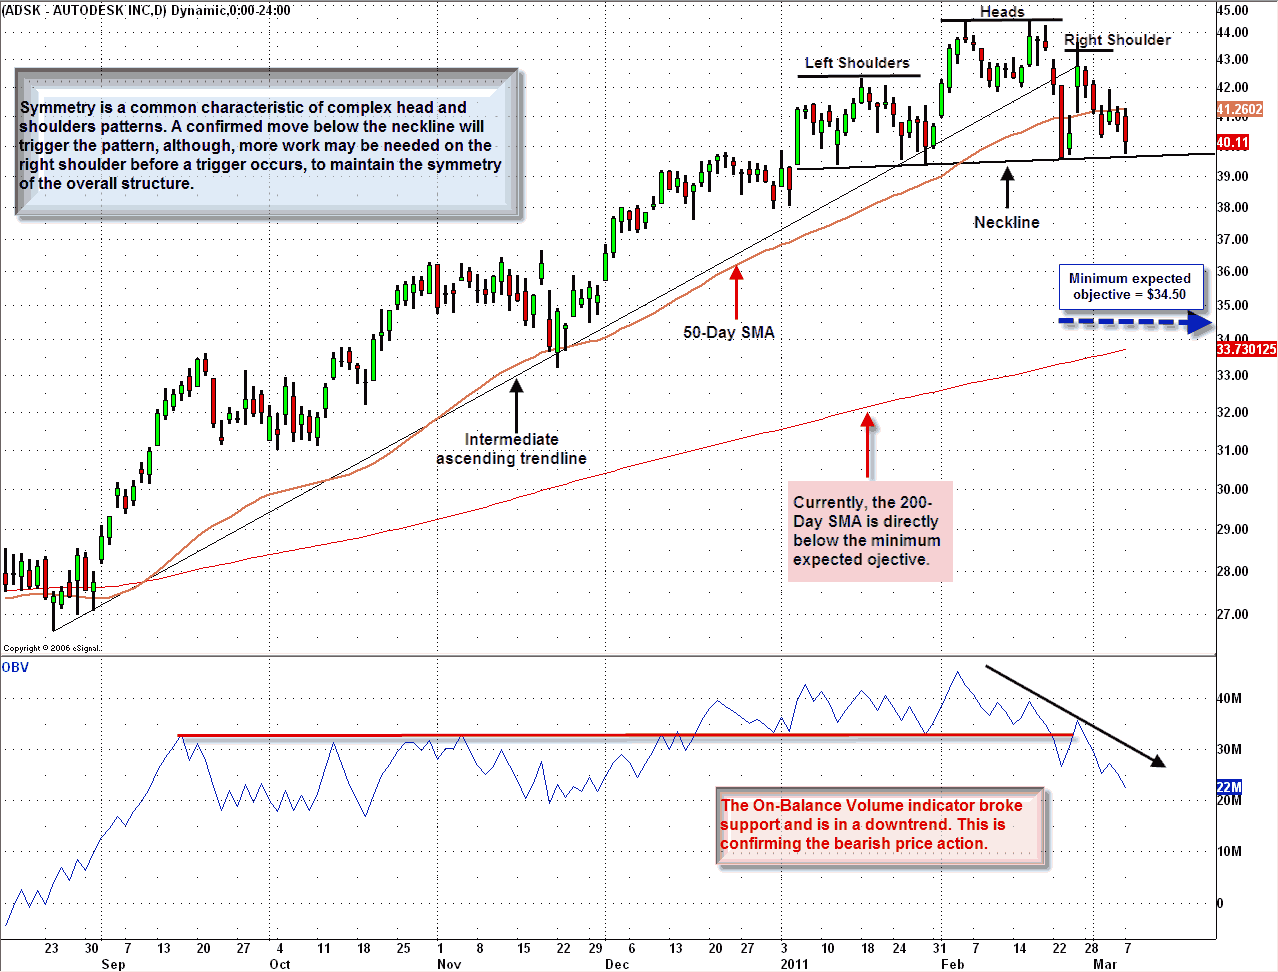
Chart 2: ADSK: An end to the intermediate uptrend was signaled by breaks of both, the intermediate ascending trend line and the 50-Day Simple Moving Average (SMA). A potential bearish complex head and shoulders pattern may be developing, which will trigger with a confirmed break of the neckline, at $39.50.
Symmetry is a common characteristic of complex head and shoulders patterns. A confirmed move below the neckline will trigger the pattern, although, more work may be needed on the right shoulder before a trigger occurs, to maintain the symmetry of the overall structure. Trigger: confirmed break of the neckline, currently 39.50. Target: $34.50 is the minimum expected price objective, obtained by measuring the height of the pattern. Currently, the 200-Day SMA is directly below the minimum objective. Protective Stop: Confirmed move back above the neckline.
(click to enlarge)
If you are interested in receiving Zev Spiro’s market letter, please email zevspiro@oripsllc.com subject “T3”
Disclosure: Long VFC

Leave a Reply