There’s been a lot of debate lately about inflation, and many conflicting opinions about whether we’re headed for inflation or deflation. The consensus among economists seems to be now leaning more towards pending deflation than inflation, and yet gold, the classic hedge against pending inflation, is still trading close to all-time historical highs of around $1200 per ounce, double the price four years ago and triple the price five years ago. Between the summer of 2008 and the end of year, the monetary base doubled, and yet the annual CPI inflation rate was negative in most months in 2009 on an annual basis. So there seems to be a lot of conflicting signals, and perhaps a breakdown of some of the traditional relationships regarding inflation and other key variables.
Here’s another twist to add to the inflation confusion – despite relatively low inflation in recent years, inflation variability is at an all-time high, another break from the traditional positive relationship between the level of inflation and level of inflation variability (or uncertainty). That is, low inflation is usually associated with low inflation variability, and high inflation is associated with high levels of inflation variability.
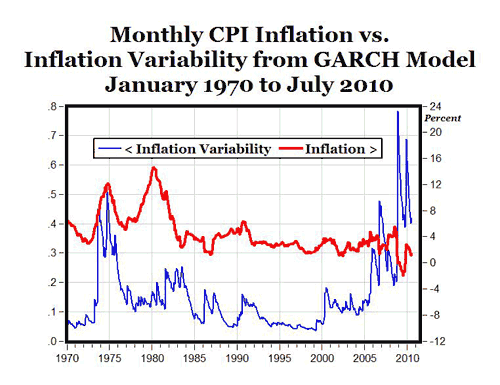
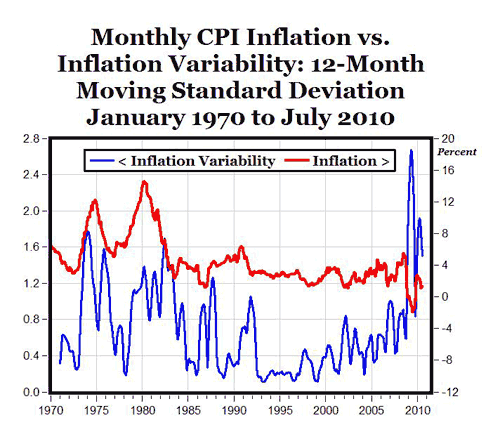
For example, the charts above show that the high levels of inflation in the 1970s and early 1980s (red lines) were associated with high levels of inflation variability (blue lines) and when inflation fell in the 1990s, it was accompanied by a fall in inflation variability. But now in recent years, we are seeing historically high levels of inflation variability associated with relatively low levels of inflation.
Note: In the top chart above, inflation uncertainty/variability (blue line) is measured with a GARCH (1,1) model and in the bottom chart inflation variability (blue line) is measured with a 12-month moving average of the standard deviation of the inflation rate. The statistical details of how to measure a time series of inflation variability aren’t as important as the fact that both of these measures of inflation variability show higher levels in recent years than the previous peaks in the 1970.
So despite low levels of inflation over the last five years, inflation variability peaked in 2009 by both measures, and those historically high levels of variability might be adding to the confusion about whether we’re headed for inflation or deflation. And the high levels of inflation variability might be a result of the Fed’s erratic, “stop-and-go” monetary policy over the last few years.


Leave a Reply