Recent short interest data for the 8/29/2014 settlement date shows an increase in short interest for shares of SINA Corporation (SINA). As of August 29, the short interest for the online media company totaled 2,798,919 shares, as compared to 2,638,046 shares since August 15, an increase of 6.10%. Average daily volume [AVM] for the same period fell by 546,000 to 1,557,150 shares from 2,103,467 shares. It is worth mentioning that ticker’s short interest has declined by more than 2.46M shares, or 47%, from the 3/14/2014 settlement date.
Based on the latest AVM, the days-to-cover ratio — a metric that includes both the total shares short and the average daily volume of shares traded — is currently 1.79 days. Days-to-cover for SINA increased to 1.79 for the August 29 settlement date, as compared to 1.25 days at the August 15 report.
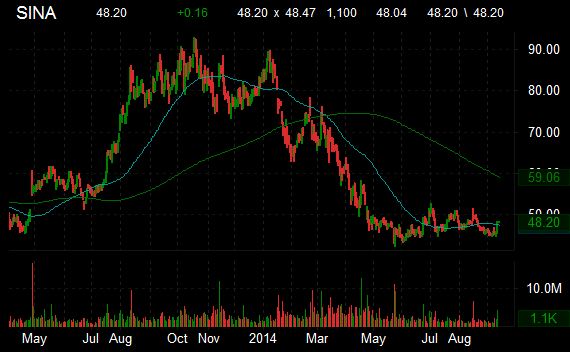
SINA Corporation has a beta of 2.22 and a short float of 4.36%. In the past 52 weeks, shares of the Shanghai, China-based company have traded between a low of $42.40 and a high of $92.83 and are now at $48.04. Shares are down 40.36% year-over-year and 42.98% year-to-date.
The chart below shows where the equity has traded over the last year, with the 50-day and 200-day moving averages included.
Recent short interest data for the 8/29/2014 settlement date shows a decrease in short interest for shares of Sohu.com Inc. (SOHU). As of August 29, the short interest for the online media and mobile services provider totaled 894,412 shares, as compared to 1,004,090 shares since August 15, a decline of -10.93%. Average daily volume [AVM] for the same period increased by more than 66,000 to 375,894 shares from 309,330 shares. It is worth mentioning that ticker’s short interest has declined by 891,000 shares, or more than 300%, from the 1/15/2014 settlement date.
Based on the latest AVM, the days-to-cover ratio — a metric that includes both the total shares short and the average daily volume of shares traded — is currently 2.37 days. Days-to-cover for SOHU decreased to 2.37 for the August 29 settlement date, as compared to 3.24 days at the August 15 report.
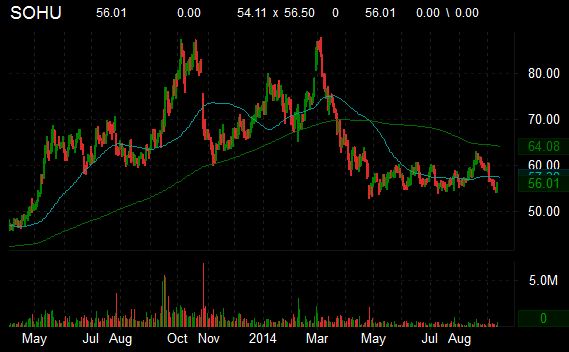
Sohu.com has a beta of 2.37 and a short float of 2.95%. In the past 52 weeks, shares of the Beijing, China-based company have traded between a low of $52.69 and a high of $87.68 and are now at $56.01. Shares are down 15.61% year-over-year and 23.20% year-to-date.
The chart below shows where the equity has traded over the last year, with the 50-day and 200-day moving averages included.
Recent short interest data for the 8/29/2014 settlement date shows an increase in short interest for shares of NetEase, Inc. (NTES). As of August 29, the Internet portal’s short interest totaled 3,768,873 shares, as compared to 3,681,807 shares since August 15, an increase of 2.37 %. Average daily volume [AVM] for the same period fell by 103,000 to 328,064 shares from 431,122 shares. It is worth mentioning that ticker’s short interest has declined by more than 269,000 shares, or 6.66%, from the 5/15/2014 settlement date.
Based on the latest AVM, the days-to-cover ratio — a metric that includes both the total shares short and the average daily volume of shares traded — is currently 11.48 days. Days-to-cover for NTES increased to 11.48 for the August 29 settlement date, as compared to 8.54 days at the August 15 report.
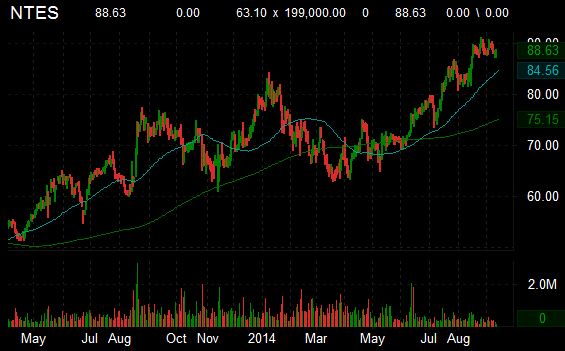
NetEase, Inc. has a beta of 1.20 and a short float of 5.23%. In the past 52 weeks, shares of the Beijing, China-based company have traded between a low of $62.88 and a high of $91.06 and are now at $88.63. Shares are up 20.65% year-over-year and 12.76% year-to-date.
The chart below shows where the equity has traded over the last year, with the 50-day and 200-day moving averages included.
Recent short interest data for the 8/29/2014 settlement date shows an increase in short interest for shares of Cree, Inc. (CREE). As of August 29, the short interest for the LED manufacturer totaled 13,208,753 shares, as compared to 12,316,828 shares since August 15, an increase of 7.24%. Average daily volume [AVM] for the same period fell by more than 1.3M to 1,365,471 shares from 2,637,045 shares. It is worth mentioning that ticker’s short interest has jumped by more than 2.69M shares, or 25.63%, from the 2/28/2014 settlement date.
Based on the latest AVM, the days-to-cover ratio — a metric that includes both the total shares short and the average daily volume of shares traded — is currently 9.67 days. Days-to-cover for CREE increased to 9.67 for the August 29 settlement date, as compared to 4.67 days at the August 15 report.
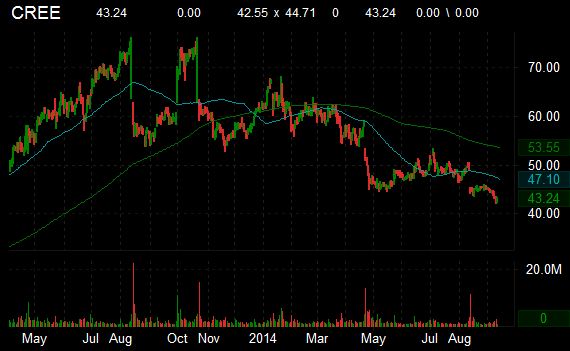
Cree, Inc. has a beta of 1.77 and a short float of 11.28%. In the past 52 weeks, shares of Durham, North Carolina-based company have traded between a low of $42.22 and a high of $75.98 and are now at $43.24. Shares are down 22.20% year-over-year and 30.84% year-to-date.
The chart below shows where the equity has traded over the last year, with the 50-day and 200-day moving averages included.
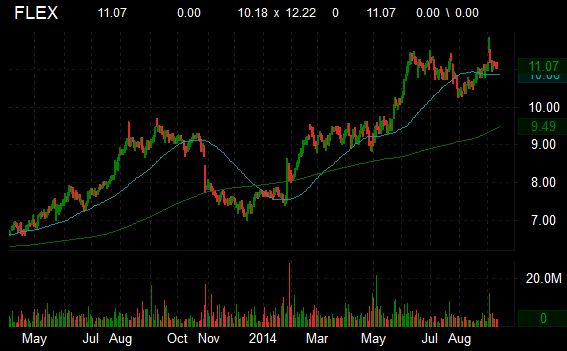
Recent short interest data for the 8/29/2014 settlement date shows a decrease in short interest for shares of Flextronics International Ltd. (FLEX). As of August 29, the short interest for the supply chain solutions company totaled 3,909,761 shares, as compared to 4,348,440 shares since August 15, a decline of -10.09%. Average daily volume [AVM] for the same period rose fractionally to 3,063,279 shares from 3,053,254 shares. It is worth mentioning that ticker’s short interest has declined by more than 10.83M shares, or 73.48%, from the 2/14/2014 settlement date.
Based on the latest AVM, the days-to-cover ratio — a metric that includes both the total shares short and the average daily volume of shares traded — is currently 1.27 days. Days-to-cover for FLEX decreased to 1.27 for the August 29 settlement date, as compared to 1.42 days at the August 15 report.
Flextronics International has a beta of 0.94 and a short float of 0.76%. In the past 52 weeks, shares of the Singapore-based company have traded between a low of $7.01 and a high of $11.83 and are now at $11.07. Shares are up 19.93% year-over-year and 42.47% year-to-date.
The chart below shows where the equity has traded over the last year, with the 50-day and 200-day moving averages included.
Leave a Reply