What will be the economic effects of this week’s developments in Libya? We have a fair amount of historical experience from which to try to answer that question.
In a recent paper, I surveyed the history of the oil market with a particular focus on major price movements and their economic effects. The table below summarizes the six episodes since World War II in which geopolitical events led to significant disruptions in the supply of oil. The last column reports the amount by which global oil supplies were reduced as a percent of world production at the time. The first five of the episodes listed in the table were followed by economic recessions, whereas the last was not.
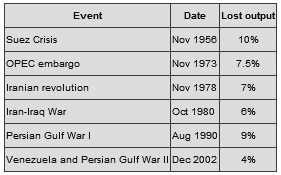
Significant historical supply disruptions
The table just reports the reduction in the flow of oil from the countries immediately affected by the events. In each case, there were production increases elsewhere in the world that offset some of the declines. For example, the Venezuelan strikes in 2002 and losses in Iraqi production in the Second Persian Gulf War in 2003 were pretty quickly made up for elsewhere.
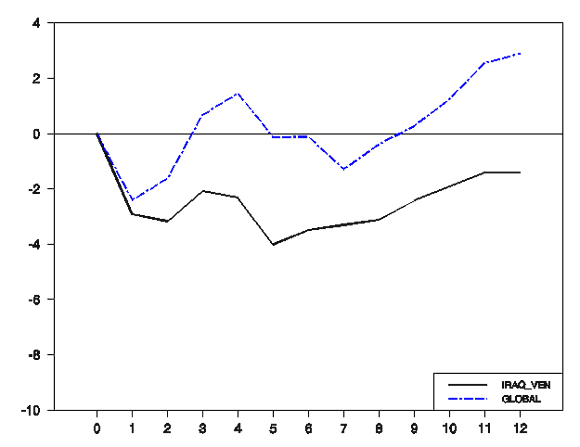
Oil production after the Venezuelan unrest and the second Persian Gulf War. Dashed line: change in monthly global crude oil production from November 2002 as a percentage of November 2002 levels. Solid line: change in monthly oil production of Venezuela and Iraq from November 2002 as a percentage of global levels in November 2002. Horizontal axis: number of months from November 2002. Source: Hamilton (2011).
Libya recently accounted for a little over 2% of global oil production. If this is entirely knocked out, it would represent a shock that is only 1/3 the size of the smallest of the first 5 historical disruptions summarized above, and perhaps comparable to Venezuela-Iraq in 2002-2003.
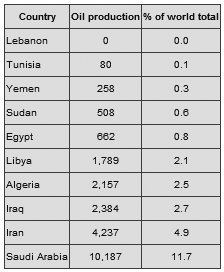
Oil production in October 2010 (thousands of barrels per day). Data source: EIA.
Next let’s take a look at the likely economic consequences for the U.S. Americans consume about 140 billion gallons of gasoline each year. I use the rough rule of thumb that a $10/barrel increase in the price of crude oil translates into a 25 cents per gallon increase in the price consumers will eventually pay for gasoline at the pump. Thus $10 more per barrel for crude will leave consumers with about $35 billion less to spend each year on other items, consistent with a decline in consumption spending on the order of 0.2% of GDP in a $15 trillion economy. The recent turmoil in North Africa has been associated with perhaps a $20/barrel increase in the price of crude and so might be expected to shave half a percent off GDP from this rough calculation.
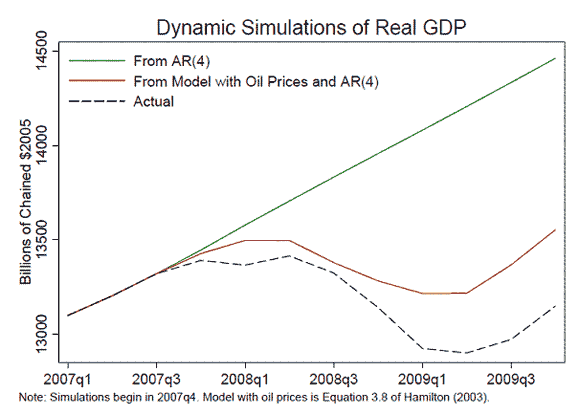
After the first five events listed in the first table above, the actual drop in consumption spending was considerably larger than rule-of-thumb calculations like these would suggest. My interpretation is that these arise from multiplier economic interactions. For example, one of the things we would see historically is a sharp drop in sales of domestically manufactured, less fuel-efficient vehicles. As employment and income in the auto sector declined, the individuals affected cut their spending on other goods, and the final drop in spending was significantly larger than that attributable to the burden of higher energy costs alone. Rising consumer pessimism that correlates with the higher energy prices also seems to have played a role. The figure below, adapted from my 2009 Brookings study, is an estimate of the degree to which these kind of nonlinear multiplier effects of the oil price increase of 2007:Q4-2008:Q2 could have contributed to the initial phase of the most recent U.S. recession. The solid line is a simple forecast for GDP over 2007:Q4 to 2009:Q4 based solely on what had been happening to GDP over 2006:Q4 to 2007:Q3 and extrapolation of the trend. The red line is a forecast based solely on GDP over 2006:Q4 to 2007:Q3 and the observed behavior of oil prices over 2007:Q4 to 2009:Q4, as predicted by a model I published in an article in the Journal of Econometrics in 2003. The dashed line is the actual behavior of GDP as we subsequently observed it.
How big might we expect those multiplier effects to be in the current setting? Detroit is selling more SUVs than it did at the low point of the downturn, but nowhere near back up to the levels of 2007. There just isn’t as far to fall, and not as much a bite autos can take out of GDP, given current conditions. Having recently seen $4 gasoline, I don’t think creeping back above $3 has the same psychological shock value. That suggests to me that the erosion of consumer confidence should be less severe. The gains in employment that I believe are underway are another important offsetting plus in terms of what’s going to happen to consumer sentiment.
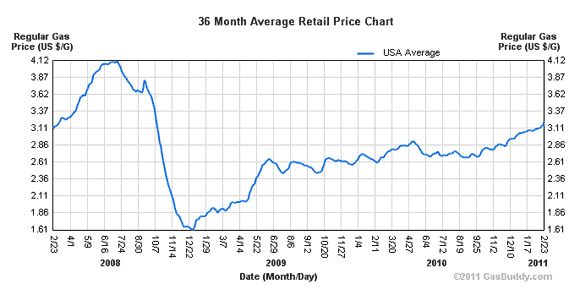
U.S. national average retail gasoline price. Source: NewJerseyGasPrices.com.
The particular dynamic model from which the above Brookings figure came builds in quite strong nonlinearities and threshold effects. Interestingly, according to that specification, one wouldn’t begin to anticipate significant effects on U.S. GDP until the price of oil got above about $130 a barrel, or until the second half of this year. Prior to that, according to that specification, we’re still ok.
I don’t want to make too strong a claim about those particular details. It’s very hard to claim precise statistical evidence in support of one choice of a threshold over another. But, this particular model has held up fairly well since its original publication in 2003. So I’m not about to abandon it just yet.
My bottom line is that events as they have unfolded so far are not in the same ballpark as the major historical oil supply disruptions, and are unlikely to produce big enough economic multipliers that they could precipitate a new economic downturn. They might shave a half percent off annual GDP growth, but I don’t anticipate a whole lot worse than that.
But the worry of course is that the big geopolitical changes we’ve been seeing didn’t stop with Tunisia, and didn’t stop with Egypt. So maybe it’s not a good idea to assume it’s all going to stop with Libya, either.
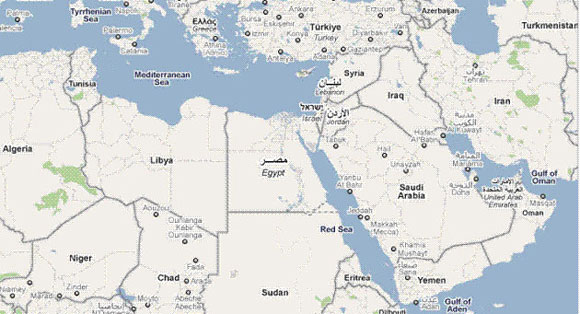
Source: Google maps.

Leave a Reply