The National Association of Homebuilders Housing Market Index (HMI) was unchanged this month at a very depressed level of 16. It is a “magic 50” index, so any reading below 50 indicates a contraction in the housing market.
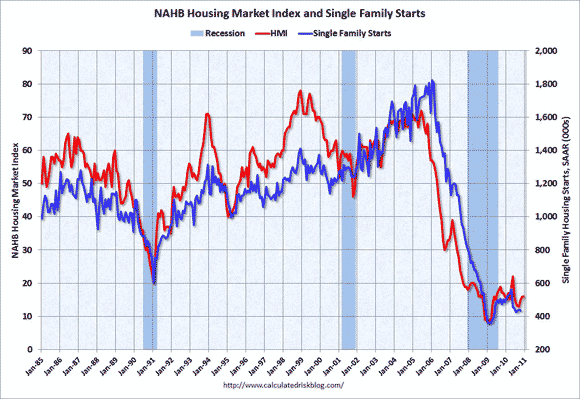
As the graph below shows (from http://www.calculatedriskblog.com) the HMI generally tracks new housing starts pretty well. It did start turning south well before the peak of single-family starts, but crossed the 50 line just about the same time that housing starts began their epic decline.
The index is composed of three sub-indexes: one gauges the current level of sales activity, another looks at expectations for new home sales over the next six months and the final one is a measure of traffic at model homes and subdivisions. The current sales index was unchanged at 16, while the expectations index was also unchanged, but at 25. The traffic index slipped one point to 11.
When one digs just a little deeper, the report is even weaker than it appears at first glance. Three of the four census regions fell. The West was down four points to 11, while the Midwest was also down, but to 13. The South, which is by far the largest of the four regions when it comes to housing data (routinely accounting for more than 50% of new home sales and starts) was off a point to 17.
All of the strength came from the Northeast, which is the smallest of the four regions by a fairly wide margin. There the index doubled, adding 12 points to 24. Since the Northeast is so small, the sample size is much smaller, and thus it tends to be the most volatile of the four regions.
Normally, housing is the locomotive that pulls the economy out of recessions, but it has been derailed this time around as we work off the effects of the housing bubble. The awful housing performance, relative to the early stages of other recoveries is the principal reason that this recession has been so sluggish.
For example, in the third quarter, if residential investment had only managed to stay at the depressed level of the second quarter rather than falling further, the economy would have grown at a 3.25% rate rather than just at a 2.50% rate. The good news is that residential investment is unlikely to fall further. It is now just 2.22% of the overall economy, down from a bubble peak of 6.24%, and a long-term average of about 4.5% of the economy.
We will get a better look at the direction of housing tomorrow when the housing starts and building permits data is released. The consensus is looking for a bit of a bounce, with starts rising to an annual rate of 545,000 in November (seasonally adjusted) from 519,000 in October.
Building Permits — the best leading indicator of starts — are also expected to show a little bit of life, rising to an annual rate of 560,000 from 550,000. Those levels though are far below the peak of 2.273 million for starts in June of 2006 and of 2.212 million for permits in January 2006. From current levels, one does not need heroic actual levels of housing starts to generate some very impressive looking percentage increases.
Homebuilding Generates Economic Activity
Even if residential investment simply stops falling, it will be an enormous weight lifted off the shoulders of the economy. Every house built generates a huge amount of economic activity. It is not just the framers and roofers that are employed by a D.R. Horton (DHI), or by the subcontractors for the major homebuilders.
Think of the materials that go into making a house. They mean jobs for lumberjacks and for people working in manufacturing building products, such as roofing materials and insulation from the Johns Mansville division of Berkshire Hathaway (BRK.B) and plumbing fixtures from Masco (MAS), among others. Because of their weight and relatively low value, most building materials are still produced here in the U.S. rather than imported. The people who are directly employed by housing also then have money to spend, perhaps going out to eat at an Olive Garden (part of Darden Restaurants (DRI) thus stimulating employment of waiters and cooks.
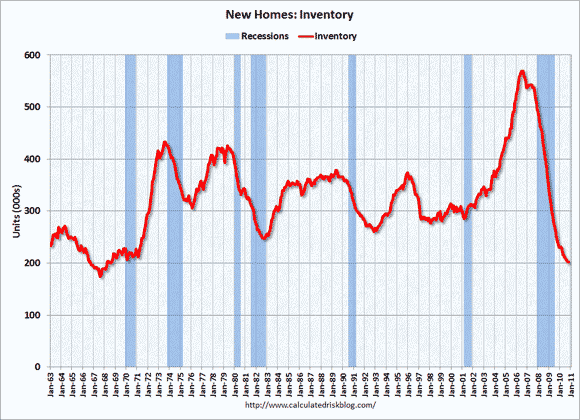
Relative to the recent sales pace, we still have a huge overhang of housing inventory, even though the absolute level of inventories for existing homes are well below the levels of 2007 and 2008. The absolute level of new home inventory, shown in the second graph (also from http://www.calculatedriskblog.com) is at its lowest level since the late 1960’s.
Household Formation
Eventually, population growth and an increase in household formation will absorb the existing home inventory. When that happens, residential investment will get into gear and the economy will begin to show very solid growth.
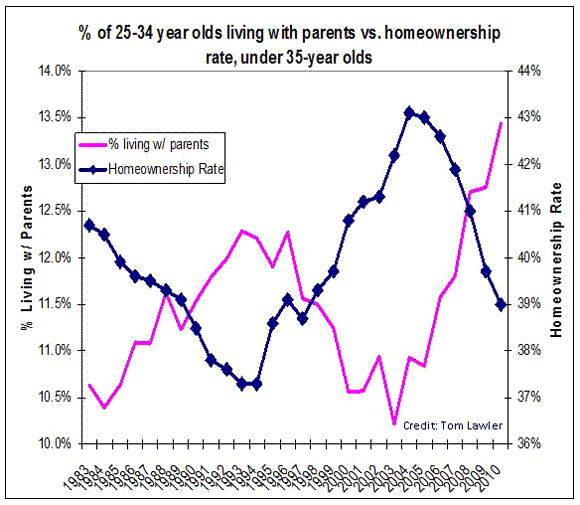
That is not going to happen right away, but the question is still “when” and not “if.” Household formation has been held back by the inability of young adults to get a job and thus be able to support having a place of their own. As a result many of them have been living with Mom and Dad. The final graph (again from http://www.calculatedriskblog.com) shows the clear inverse relationship between the homeownership rate for young adults and the number of them that are still living with their parents.
There are some signs that things are starting to improve. Many young adults don’t directly move from living with their parents to owning their own place. The intermediate step is to rent an apartment. The apartment vacancy rate fell to 7.2% in the third quarter from 7.8% in the second quarter. While that is still above normal, it is moving in the right direction and indicates that we might be starting to see a pick up in the rate of household formation.
Of course, if residential investment were to pick up, more of those people would have jobs, and the rate of household formation would increase still further. We could thus get into a self-sustaining virtuous circle. First, though, we have to break the vicious circle we have been in.
A pickup in the rate of housing starts would be evidence that the vicious circle is being broken, but I would want to see several months of an upward trend before I concluded that the virtuous circle had started. I will, of course, have a full breakdown of the housing starts data posted shortly after the numbers come out tomorrow.

Leave a Reply