It’s commonly thought that a market-liberal political economy is best for the rich while a social-democratic one is best for the poor. Some recent research suggests reason to question this. Analyses by Willem Adema of the OECD, by Adema and Maxime Ladaique, and by Price Fishback conclude that the quantity of social expenditures in the United States is similar to or greater than in Denmark and Sweden, two nations long considered large-welfare-state exemplars.*
How so? Government social transfers account for a much larger share of GDP in Sweden and Denmark. But the U.S. government distributes more benefits in the form of tax breaks rather than transfers than do the two Nordic countries; Denmark and Sweden tax back a larger portion of public transfers than the United States does; private social expenditures, such as those on employment-based health insurance and pensions, are greater in the U.S.; and America’s per capita GDP is larger.
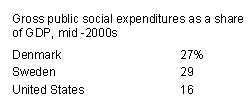
The standard indicator of social policy effort is gross public social expenditures as a percentage of GDP. Denmark and Sweden are much higher than the United States on this measure.
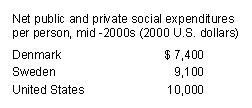
Now shift to net (rather than gross) public and private (rather than public alone) expenditures per person (rather than as a percentage of GDP, with purchasing power parities used to convert Danish and Swedish kroner into U.S. dollars). According to the calculations by Adema and Ladaique (Fishback’s are similar), we get a very different picture. By this measure the U.S. is the biggest spender.
This looks like good news for the poor in the United States. Is it? Unfortunately, no. These adjustments change the story with respect to the aggregate quantity of resources spent on social protection in the three countries, but they have limited bearing on redistribution and on the living standards of the poor.
Begin with tax breaks. Researchers count as “social” those designed to provide support in circumstances that adversely affect people’s well-being. In the United States these disproportionately go to the affluent and the middle class. The chief ones are tax advantages for employer and employee contributions to private health insurance and private pensions. These do little to help people at the low end of the distribution, who often work for employers that don’t provide health or retirement benefits. One valuable tax benefit for low-income households is the Earned Income Tax Credit (EITC), but it is already included in the standard OECD data on government social expenditures. Another is the child tax credit, but it is non-refundable and so of limited value to low-income households, many of whom don’t owe any federal income tax.
Next consider tax “clawbacks” in the Nordic countries. Public transfer programs in Denmark and Sweden tend to be “universal” in design: a large share of the population is eligible for the benefit. This is thought to boost public support for such programs. But it renders them very expensive. To make them more affordable, the government claws back some of the benefit by taxing it as though it were regular income. All countries do this, including the United States, but the Nordic countries do it more extensively. Does that hurt their poor? Very little. The tax rates tend to increase with household income, so much of the tax clawback hits middle- and upper-income households.
What’s the impact of private social spending? In the U.S. this accounts for roughly two-fifths of all social expenditures. It consists mainly of employer contributions to health insurance and employment-based pension benefits. Here too the picture changes a great deal on average, but not much for the poor. Employer-based health insurance and pension plans reach few low-income households.
So how well-off are the poor in the United States, with its “hidden welfare state,” compared to social-democratic Denmark and Sweden? One measure is average posttransfer-posttax (“disposable”) income among households in the bottom decile of the income distribution. Here are my calculations using the best available comparative data, from the Luxembourg Income Study (LIS). (The numbers are adjusted for household size. They refer to a household with a single adult. For a family of four, multiply by two.)
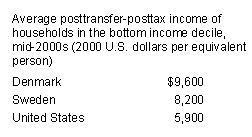
This is a pretty big difference, not in America’s favor.
In his paper, Fishback cites similar numbers from the OECD. He cautions, though, that “One advantage the poor Americans would have had in spending their disposable income is that they face consumption tax rates in the 4 to 7 percent range, while consumption taxes in the Nordic countries are above 20 percent.” Actually, consumption tax rates are incorporated in the purchasing power parities (PPPs) used to convert incomes to a common currency, so these income figures already adjust for differences in consumption taxes.
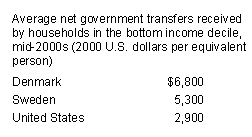
What’s the source of this cross-country difference in the incomes of low-end households? It’s entirely a function of government transfers. Again using the LIS data, I’ve calculated mid-2000s averages for households in the bottom income decile for the three chief sources of household income: earnings, net government transfers (transfers received minus taxes paid), and “other” income (money from family or friends, alimony, etc.). Average earnings are virtually identical across the three countries, at about $2,500. The same is true for “other” income, which averages around $500 in each of the three. Where bottom-decile Danish and Swedish households fare much better than their American counterparts is in net government transfers:
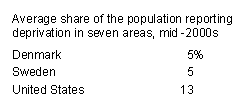
Fishback rightly points to one other key difference between these countries: “Public services not counted in disposable income, like health care and education, likely are better for the very poor in the Nordic countries than in the United States.” It’s difficult to measure the impact of services on living standards with any precision. One indirect way to assess their effect is to switch from income to material deprivation. Two OECD researchers, Romina Boarini and Marco Mira d’Ercole, have compiled material deprivation data from surveys in various rich nations as of the mid-2000s. Each of the surveys asked identical or very similar questions about seven indicators of material hardship: inability to adequately heat one’s home, constrained food choices, overcrowding, poor environmental conditions (e.g., noise, pollution), arrears in payment of utility bills, arrears in mortgage or rent payment, and difficulty in making ends meet. Boarini and Mira d’Ercole create a summary measure of deprivation by averaging, for each country, the shares of the population reporting deprivation on questions in each of these seven areas.
Government services — medical care, child care, housing, transportation, and so on — reduce material hardship directly. They also free up income to be spent on other needs. The comparative data, though by no means perfect, are consistent with the hypothesis that public services help the poor more in the Nordic countries than in the United States. The gap between the countries in material deprivation is larger than in low-end incomes.
Helping the poor is not, of course, the only thing we want from social spending. But it surely is one thing. The United States spends more money on social protection than is often thought, yet that spending doesn’t do nearly as much to help America’s poor as we might like.
For those interested, I’m finishing up a book manuscript that looks at this issue and related ones in more detail.
__________
* Related research: Adema, Garfinkel-Rainwater-Smeeding, Hacker, Howard. Blog commentary: Fishback, Salam, Schulz, Wilkinson, Yglesias.

The welfare state model creates certainty. Consumers like certainty. That should be the Wall Street perspective. God, can you guys quit hoarding money for like two seconds?