You may recall that a week ago I made a sort of “Emperor has no clothes” accusation against the economics profession. I claimed that economists are always talking about “easy money” and “tight money” without have any coherent definition, indeed not even knowing that they have no coherent definition. In this post Bob Murphy challenges my dismissal of real interest rates as the proper indicator. He makes some good arguments, which I will address as well as I can, but in the end I am still left with 4 reasons for dismissing the view that real interest rates provide a useful indicator of the stance of monetary policy. Furthermore, I think that any one of these four arguments would be sufficient to prove my point:
1. The theoretical argument:
Contrary to widespread impression, there is no theoretical presumption in a IS-LM model that easy money lowers real interest rates. As Robert King pointed out in the JEP (pp. 77-78, 1993):
If changes in the money stock are persistent, then they lead to persistent changes in aggregate demand. With a rational expectations investment function of the neoclassical form, persistent changes in demand for final output lead to quantitatively major shifts in the investment demand schedule at given real interest rates. These effects are generally sufficiently important that real interest rates actually rise with a monetary expansion rather than fall: the IS curve effect outweighs the direct LM curve effect. Further, if persistent changes in the money stock are only gradually translated into price or wage increases, then there are very large additional expected inflation effects on nominal interest rates.
In December 2007 I noticed that a contractionary surprise by the Fed actually reduced 3-month T-bill yields for exactly the reasons mentioned King. I don’t have any data on 3-month real rates, but it wouldn’t surprise me if they fell as well. Indeed the reason most economists assume that Fed easing lowers real rates is simply that they assume easy money lowers nominal rates, and it stands to reason that easy money couldn’t lower inflation expectations. Ergo, real rates must have fallen. But once you realize that easy money doesn’t always reduce nominal rates then it becomes clear that there is no reason why it should necessarily reduce real rates either.
The implication of King’s observation is that even if my next three arguments are all wrong, if real rates did not in fact rise late last year, it would still not make real interest rates a good indicator of monetary policy.
2. I showed you mine, now you show me yours:
When I mention to other economists that real rates rose dramatically between July and November 2008, the reaction is usually: “Oh my gosh, I never noticed that.” Then they scramble around for some way to discredit my argument. Perhaps the real interest rate in the TIPS market is not the “correct” real interest, despite the fact that it is the only direct, objective, measure of real interest rates that we have. If you were looking for a risk-free real interest rate, what better place is there to look than the rate on indexed, risk-free, government bonds? Aren’t these bonds virtually the textbook definition of what economists mean by “the” real interest rate?
Now if you look hard enough it is possible to find flaws in any measure of real interest rates, but let’s go back and deconstruct what is really going on here. Why don’t the economists I talk to react to my statement about TIPS yields by saying: “Oh, am I glad to hear that! I was having trouble understanding how AD could have been falling so fast last year during a period when money was easy. Now that you’ve explained money was tight, the whole picture makes sense; the falling commodity, real estate and equity prices, falling industrial production, as well as the soaring value of the dollar against the euro.”
But guess what, not one economist has reacted that way. Instead they all look for ways to dismiss the TIPS yields. This tells me two things. First, that they have already made up their minds, they have already decided that money was easy, and now they are simply looking for some way of validating their prior beliefs. And second, the fact that the TIPS yields were news to most economists that I talk to means that they really don’t pay any attention to real rates at all. Most probably just look at nominal rates, and assume that that’s all they need to know. Or perhaps nominal rates adjusted by backward-looking inflation, which is almost as bad. Only when it is pointed out that nominal rates are extremely unreliable do they claim that “economists use real interest rates as the indicator of monetary ease and tightness.” OK, then where is your real interest rate indicator? I showed you my TIPS yields, what are you using? In fact, if economists really were interested in real rates they would at least know the stylized facts of what happened to the TIPS yields last year, even if only to reject them and look elsewhere for real rates. But many don’t even pay enough attention to real rates to know that the TIPS yields soared, and yet they’re quite confident that they “know easy money when they see it.”
Bob Murphy does have some good arguments. He points out that nominal rates on Treasury bonds fell significantly in the last half of 2008, and that it seems improbable that inflation expectations were falling much more sharply. It seems improbable to me as well, but it seems to have occurred.
3. Inflation expectations did plummet:
In this section I will explain why I think inflation expectations did plummet last July through November, despite the many attempts to cast doubt on this sea change in expectations. For those of you having trouble visualizing how expectations could change so fast, recall that in early July oil was $147 a barrel, and people were worried about inflation. By November commodity prices and economic activity were in free fall. Real estate prices were also plunging. Wages cuts were on the horizon. T-bill yields were near zero, and the specter of Japan was increasingly being mentioned. That’s a pretty big change in 4 months.
Yes, there are reasons to question the relevance of the TIPS spreads. Bob mentions the fact that TIPS yields should never be higher than non-indexed Treasury yields, because the bonds can only be indexed upward at maturity, not downward (with deflation.) Nevertheless, if you use existing “off the run” TIPS, that have already had some accrued gains due to past inflation, the value may be expected to fall from current levels as future deflation undoes some of the positive indexing from past inflation.
Bob also raised the issue of liquidity. Bob (and others) alleged that there was a mad rush for liquidity last fall, and that it drove T-bond prices much higher than they otherwise would have been. Because TIPS are less liquid, their prices fell relative to T-bonds, and thus the yields rose. And (so the story goes) this has nothing to do with falling inflation expectations. Sorry, I just don’t buy this explanation. It certainly contains a grain of truth, but nowhere near enough grains to explain the bond market movements in this graph, which I took from Bob’s post:
And BTW, here is what Bob wrote to explain his state of mind on seeing what actually happened to real interest rates last year:
Here’s the chart that Scott refers to, and I must confess at first it shocked me:
Shocked?!? I’m shocked that he’s shocked, as I indicated in the previous section. (But in his defense, Bob does pay attention to the monetary base, so he is not one of those economists that I accused of just relying on nominal rates.) Here’s my take on the graph, and I freely admit to being no bond market expert, so please take this as just a hypothesis. The rise is real rates in the 5-year TIPS market was exaggerated by two factors:
1. There’s a small lag in indexing to the CPI. Thus when commodity prices move dramatically a near-term CPI adjustment in the TIPS is predictable, but doesn’t truly represent forward-looking “expected inflation.” In the last half of 2008 this biased upward the rise in real rates. Fortunately, on a 5-year bond this bias should be no more than a few dozen basis points. And rates rose more than 350 basis points.
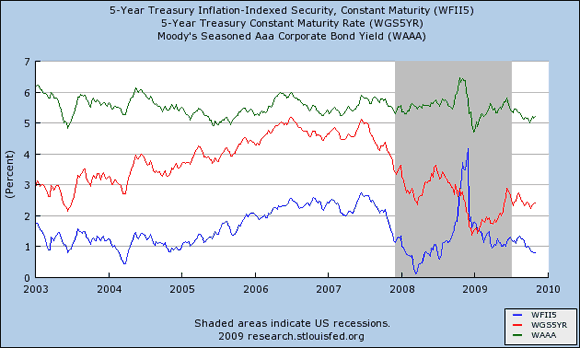
2. The liquidity issue mentioned by Bob may have also biased upward the rise in real rates. But here’s why I don’t think it was a big factor. Bob focuses on the difference between TIPS and non-indexed T-bonds. And also the fact that real yields required by investors in safe government bonds soared during a period of turmoil:
I have also included the yield on AAA bonds to show that they spiked too, though not as much, as TIPS yields did, precisely at the time that the nominal Treasury yields collapsed. Again, I’m not saying that I know exactly what was going on for these critical months, but what I am saying is that the above chart is not what you’d expect from a straightforward collapse in the expectations of real GDP growth and CPI growth.
I agree the pattern looks kind of odd. I admit the fall in inflation expectations and the rise in real rates seem a bit steep. What troubles me the most is that for a brief period we had negative inflation expectations over 5 years. I find that implausible (although let’s not lose sight of the fact that Japan experienced some persistent mild deflation, we were in the midst of one year’s worth of mild deflation, and also that things seemed pretty scary around that time.)
But here’s what I think is more interesting. Notice that TIPS yields (which after all are real interest rates) soared dramatically relative to AAA bond yields. It looks to me like the AAA bond yields increased about 1%, whereas the TIPS yields rose about 3.5%. This implies a fall of inflation expectations of 2.5% over just 4 months. That’s pretty impressive. Now you might be thinking that AAA and TIPS are not perfect substitutes. True, but to the extent they differ it understates the fall in inflation expectations. Why? Because the AAAs were increasingly seen as being risky during that 4 month period. Recall that this was when the bond ratings were found to be unreliable, even for AAA bonds. So even if there was no change in inflation expectations, you would have expected AAA yields to have risen significantly relative to TIPS yields. This implies that the actual increase in inflation expectations was considerably larger than 2.5%.
What about the earlier liquidity argument? I don’t see how that could apply to the TIPS/AAA spreads. If anything I would consider AAA bonds to be less liquid than TIPS. Yes, TIPS may seem illiquid when compared to regular Treasury bonds, but compared to anything else in the universe they are pretty liquid assets. Their market now runs into the $100s of billions. Unlike AAA bonds, all TIPS have the same default risk (virtually zero.) The bid-asked spread in the TIPS market is very small. And yet unless AAA bonds were significantly more liquid than TIPS, it seems to me that it is pretty hard to deny that inflation expectations fell by significantly more than 2.5% in late 2008.
So I end up remaining convinced that our best estimates show sharply rising real interest rates during the key July to November 2008 period, albeit the increase in real rates may have been less than implied by the TIPS markets. And even if some bond expert comes in here and blows this argument out of the water, I still think the TIPS yields are the “correct” real interest rate if we are trying to estimate the stance of monetary policy. The next section will explain why.
4. Two pragmatic arguments:
Even if inflation expectations did not fall sharply in late 2008, and the real interest rate on T-bonds did not rise sharply, I would continue to argue for the relevance of TIPS yields on two pragmatic grounds. (Here I’m adopting my normal “‘wildly throw enough darts at the target and hope at least one hits” approach):
a. Let’s think about what we look for in the stance of a monetary policy indicator. I picture one of those robots from a 50s sci-fi movie. When policy is going off course you want the indicator to bark out “Warning, warning, danger Will Robinson, err, I mean danger Ben Bernanke.” Red lights should be flashing in all of the halls in the Fed DC headquarters. Now think about this. If TIPS, which are perfectly good bonds, are seeing their yields soar through the roof in September 2008 because the financial system is imploding and there is such a mad scramble for liquidity that T-bonds are the only thing anyone is willing to hold, umm, perhaps might it be time to consider cutting the Fed funds rate from say 2%, to 1.75%? I guess not, as they didn’t take that radical step. Yes, I suppose that would have been reckless inflationism.
b. Where is it carved in stone that T-bonds are the right asset for our model? Yes, they are risk free , but so are TIPS. Couldn’t you argue that if there is a wild scramble for T-bonds then they are the outliers, those are the yields that are unreliable, and TIPS are more like the broader class of “normal bonds?” I often call myself a methodological pragmatist. There is no theoretically pure answer to economic questions, it all boils down to what works best. So consider the following argument. A banker is considering making a loan, or considering the purchase of a risky corporate bond. What sort of rate of return is required to make the banker take action? What is the opportunity cost of funds than the banker is contemplating using in this investment? Is it the T-bond yield of 2%, minus some unknown inflation risk, or the TIPS yield of 4%, which is guaranteed in real terms with no default risk? The answer seems obvious to me. No banker in her right mind would lend out money unless the real rate of return was expected to be considerably higher than 4%. After all, regardless of how one feels about the liquidity argument discussed earlier, one can’t dodge the fact that anyone could walk into the TIPS market last November and buy a risk free asset with a very high real rate of return. So how does that not become a minimum estimate of the real opportunity cost of funds? Especially for bankers contemplating using the funds in very high-risk investments in a rapidly deteriorating economy. I don’t know about you, but those sorts of risk-free real rates don’t seem appropriate in a severe deflationary recession, regardless of the liquidity characteristics of indexed bonds.
Of course as the economy began to decline sharply, real rates came down rapidly. It should be mentioned however, that some graphs exaggerate the speed of the decline by shifting to a “on the run” bond around December 1st, 2008. Mankiw discussed this problem in his blog around that time.
One other brief comment. Bob takes me to task for harping on market expectations as being the gold standard of forecasts, but quietly ignoring the fact that the gold market itself is screaming high inflation. I view the gold market as a world market affected by real factors like rising wealth in India and China (where gold is popular) and not being as specifically focused on US inflation expectations as the TIPS markets. But yes, I’ve also been surprised by the strength of gold. If we have high inflation over the next couple years (beyond just an oil blip) it would undercut my model. My last stand will be core inflation, if that shoots up I’ll just quietly slip away.
Disclaimer: This page contains affiliate links. If you choose to make a purchase after clicking a link, we may receive a commission at no additional cost to you. Thank you for your support!


Leave a Reply