
The key to drinking is not to stop.
-Charlie Sheen
Mr. Market has done a great impersonation of Charlie Sheen since early January — the key to momentum being more momentum.
Momentum is the animal spirit that drives market psychology.
Momentum is its own justification.
At the January/Feb bottom few could believe how low we’d gone and we’re expecting lower.
Few can believe how far/how quickly we’ve come — and expect higher.
TSLA stock exemplifies the momentum. Since February 9, it rose nearly 100% in just under 60 calendar days.
Underpinning that momentum is the fact that Tesla Motors Inc (NASDAQ:TSLA) did not turn its Weekly Swing Chart down until Tuesday.
Other than a pullback into March 24 that subscribers capitalized on, TSLA’s advance has been uninterrupted — from the 141 low to the early April 269 high.
That high left bearish Train Tracks and underscores the concept that 1st sell signals are often squeezed.
Note that on April 1, TSLA left a high-volume reversal day. It did not produce downside follow through suggesting that the subsequent 3 day run of 36 points was a buying climax — at least in the short-term.
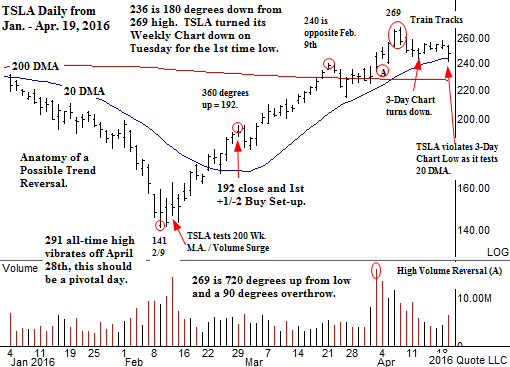
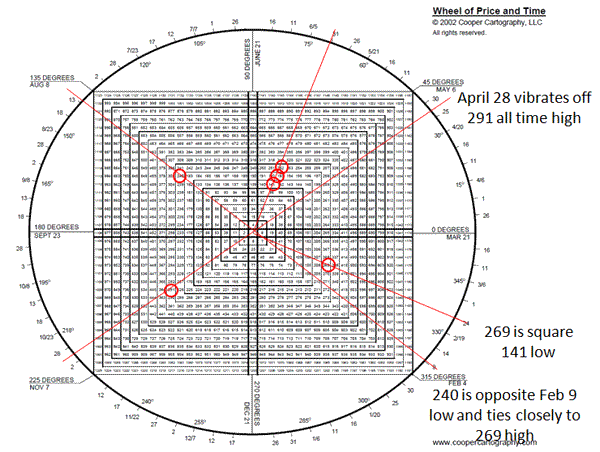
From the 241 low to the 269 high represents a 810 degree move (9 squared) or 2 revs of 360 plus a possible 90 degree overthrow.
Let’s examine the price harmonics.
A 360 degree advance ties to 192.
TSLA barely reacted suggesting higher.
252 is 720 degrees up and since TSLA closed back below 252 it suggests it is vulnerable.
Note that the 240 pivot high is opposite February 9th (the low day).
TSLA turned its 3 Day Chart down immediately following this months Train Tracks and potentially bearishly violated that low yesterday in tandem with a test of its 20day line — the first such test since reclaiming it on 2/22.
See sq of 9 here.
Several other glamours look like they’ve run out of gas here. Names include Amazon.com Inc. (NASDAQ:AMZN), Apple Inc. (NASDAQ:AAPL), Netflix Inc. (NASDAQ:NFLX) and Facebook Inc (NASDAQ:FB).
In short, the FANG’s plus TSLA look ragged and may be canaries for a coming decline.
Conclusion.
This 2100 SPX level is a big number being 3600 degrees up from 666.
Interestingly, it also ties to 666 X Pi.
The presumption is a first sharp break is on the table soon followed by a possible return rally test, a mirror image of the Jan/Feb bottom.
However, because April is year end for many big funds, there is no guarantee of a return rally test — liquidation could hit and fail to see subsequent traction with the specter of two waterfall declines between August and January playing out.


Leave a Reply