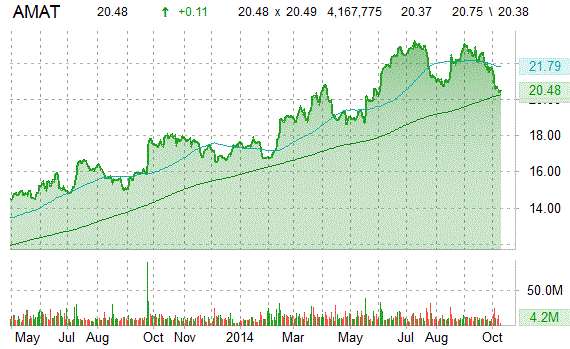
Applied Materials, Inc. (AMAT) was upgraded by Credit Agricole from an ‘Underperform’ rating to an ‘Outperform’ rating in a research note issued on Wednesday. The firm currently has a $23.00 price target on the stock, up from their previous price target of $22.00. CA believes that Tokyo Electron deal concerns are overdone and the company will not go through with the transaction if it turns out to be dilutive.
Applied Materials shares are currently priced at 25.36x this year’s forecasted earnings compared to the industry’s 10.54x earnings multiple. Ticker has a PEG and forward P/E ratio of 1.59 and 15.12, respectively. Price/Sales for the same period is 2.82 while EPS is $0.81. Currently there are 13 analysts that rate AMAT a ‘Buy’, 7 rate it a ‘Hold’. 2 analysts rates it a ‘Sell’. AMAT has a median Wall Street price target of $25.00 with a high target of $30.00.
In the past 52 weeks, shares of Santa Clara, California-based company have traded between a low of $16.40 and a high of $23.46 and are now at $20.55. Shares are up 16.53% year-over-year and 16.40% year-to-date.
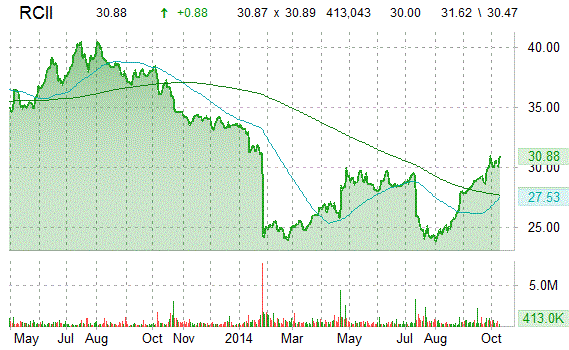
Shares of Rent-A-Center, Inc. (RCII) are rising 3.7% this morning after the stock was upgraded to ‘Buy’ from ‘Neutral’ with a $38 price target at Northcoast. The firm’s price target would suggest a potential upside of 19.98% from the stock’s current pps.
RCII shares recently gained $0.94 to $30.94. In the past 52 weeks, shares of Plano, Texas-based company have traded between a low of $23.42 and a high of $37.49. Shares are down 14.19% year-over-year and 7.81% year-to-date.
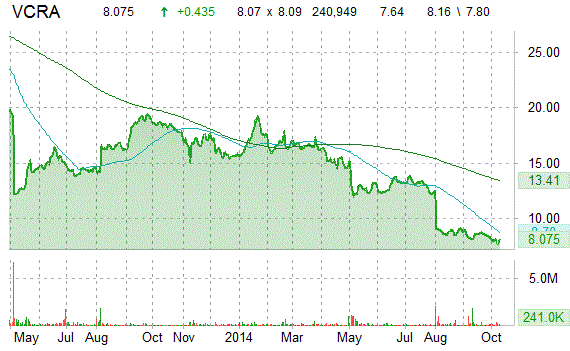
FBR Capital is out with a report this morning upgrading shares of Vocera Communications, Inc. (VCRA) with an ‘Outperform’ from ‘Market Perform’ rating and $10 price target, implying 22.69% expected return from the stock’s current price.
VCRA shares recently gained $0.42 to $8.06. In the past 52 weeks, shares of San Jose, California-based company have traded between a low of $7.58 and a high of $19.33. Shares are down 59.19% year-over-year and 51.06% year-to-date.
The chart below shows where the equity has traded over the last 52 weeks, with the 50-day and 200-day MAs included.
Leave a Reply