Yahoo (YHOO)’s move to hold its Alibaba (BABA) stake longer than originally planned, didn’t seem to help the web portal’s stock, which is down more than 2% in mid-day trading Thursday.
Yahoo said in a regulatory filing on Wednesday that it has agreed to a one year lock-up period with the underwriters related to the sale of the remaining ordinary shares of Alibaba Group after its massive IPO last week. Following completion of the IPO, which saw Yahoo sell all of its 140 million ADRs, the search giant still retains 383.57 million BABA ordinary shares, representing about 15% of Alibaba’s outstanding ordinary shares, worth between $36 billion to $38 billion (not a bad trade, considering Yahoo acquired its Alibaba stake for $1 billion in 2005).
Although Alibaba’s $25 billion IPO has helped ease the pain of Yahoo’s struggles in internet advertising, the Sunnyvale, California-based company continues with its efforts to stabilize its declining revenues, which have deteriorated from a peak of $7.2 billion in FY 2008 to a projected $4.5 billion this year, a decline of nearly 40%.
On Thursday, analysts at RBC Capital downgraded Yahoo from ‘Outperform,’ to ‘Sector perform”, an indication that the brokerage firm expects the company to perform in line with its peers. Yahoo shares are currently priced at 32.52x this year’s forecasted earnings compared to the industry’s 17.43x earnings multiple. Currently there are 4 analysts that rate YHOO a ‘Strong Buy’, 9 rate it a ‘Buy’ and 13 rate it a ‘Hold’. No analysts rate it a ‘Sell’. YHOO has a median Wall Street price target of $42.00 with a high target of $48.00.
Yahoo’s shares have advanced 3.42% in the last 4 weeks and 17.29% in the past three months. Over the past 5 trading sessions however, the stock has lost 7.33%. YHOO has surged 24.44% over the past 52 weeks, while the S&P 500 index has gained 17.64% in the same period.
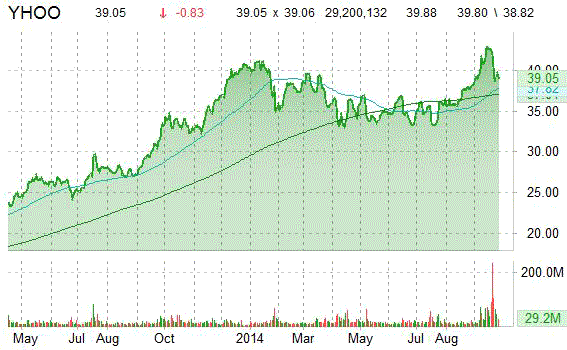
Yahoo’s stock was down 87 cents, or 2.17%, to $39.01 in Nasdaq trading.
The chart below shows where the stock has traded over the last year, with the 50-day and 200-day moving averages included.

Leave a Reply