So says David Malpass in the WSJ:
Data released this week by the Commerce Department waved bright red recession flags—orders for durable goods fell 13.2% in August and inflation-adjusted personal income fell 0.3%. … the new Commerce Department numbers, combined with his stay-the-course approach, point to recession in 2013.
And James Pethokoukis writes “GDP collapse puts U.S. economy into recession red zone.”
I think it’s at times like this it behooves one to consult the forecasting record; for instance, back in June 2008, David Malpass stated:
While many problems remain from the 2007-2008 financial crisis, the rebound from the two-quarter slowdown looks to have taken root. I expect 1-2% growth in the second quarter and 3% in the second half. Rising inflation and Fed rate hikes later in 2008 will bring periodic worries about the pace of rate hikes, causing occasional market jitters like the current one. But the low level of interest rates should win out for both the economic and equity market uptrends (as it did during the rate-hiking cycle in 2004-2006).
It’s also of interest to recall the eloquent title of the Pethokoukis piece in which the Malpass quote appears; it’s ”Dude, Where’s My Recession? The Series”.
Even if the sources of these worries are less than fully credible, I will not “pull a Lazear” (or a Don Luskin, for that matter), and rule out a priori the possibility of recession. Rather, it seems appropriate to examine the indicators the NBER Business Cycle Dating Committee (BCDC) uses to determine peaks and troughs. As the NBER BCDC notes, the key indicators are GDP, nonfarm payroll employment, industrial production, personal income ex.-transfers, and manufacturing and trade sales. Figure 1 depicts official GDP from the BEA (3rd release for 2012Q2), and from Macroeconomic Advisers (the e-forecasting series is added for reference, since I have a longer series for that).
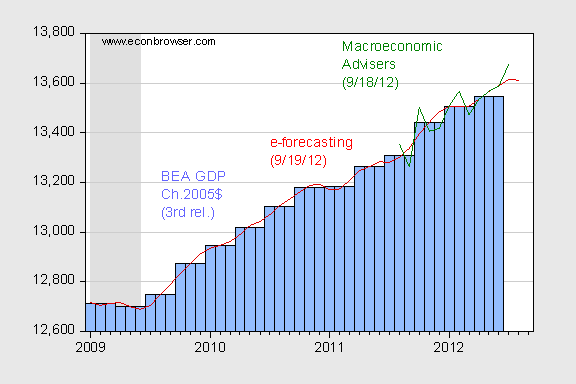
Figure 1: Official GDP (Ch.05$) SAAR (blue bars), monthly GDP from MA (green line), from e-forecasting (red line). NBER defined recession dates shaded gray. Source: BEA, 2012Q2 3rd release, Macroeconomic Advisers (9/18/2012), and e-forecasting (9/19/2012).
The e-forecasting series has flattened out, while MA’s series running through July is still rising.
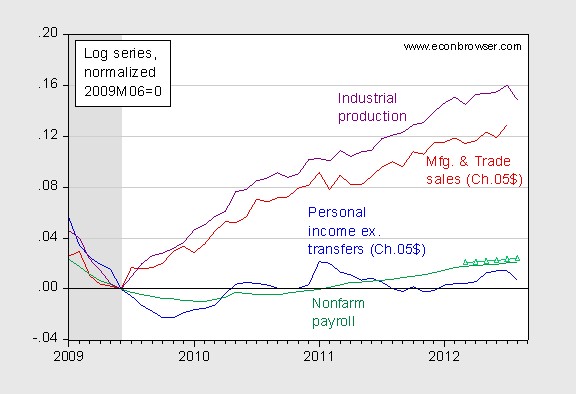
Figure 2: Personal income ex. transfers (blue), manufacturing and trade sales (red), nonfarm payroll employment (green), and adjusted upward by CES benchmark revision for March 2012 (green triangles), and industrial production (purple), all in logs, normalized to 2009M06=0. Source: BEA, BLS and Fed via FRED, NBER, and author’s calculations.
Employment rose into August (and will likely be revised upward, given the annual benchmark revisions that were reported last week [1]), while income and industrial production fell. Hence, it is conceivable that we are at a peak.
On the other hand, the term premium is signaling no-recession.
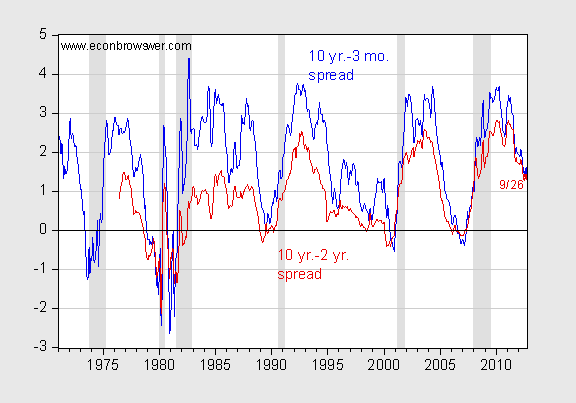
Figure 3: Ten year-three month spread (blue), and ten year-two year spread (red). September observations are for 9/26. NBER defined recession dates shaded gray. Source: FRED, NBER, and author’s calculations.
Both spreads are positive; this is suggestive of a still growing economy. Chinn and Kucko (2010) estimate for the US over the 1973-2009Q2 sample:
Δipt+1 = -0.037 + 1.630spreadt
So, industrial production growth over the subsequent one year period is predicted by the spread; a one percent higher spread is correlated with roughly one percentage point faster growth over the next year. This finding is robust to the use of real-time data:
Δipt+1 = 1.698 + 0.794spreadt
One can worry if historical correlations would still be informative with respect to current conditions, given the implementation of quantitative easing and Operation Twist, and the encounter with the zero interest bound. However to me, this suggests the spread would be much larger than is observed, in the absence of these phenomena.
Jim Hamilton’s indicator (for 2012Q1) remains at neutral, as it has since August 2009. Mike Dueker’s index remains positive, into August. The Aruoba-Diebold-Scotti business conditions index is around -0.5 for 2012Q3, which is comparable to levels in 2003.
I said I would not “pull a Lazear”. So I end by contrasting the distribution of forecasts of growth from the WSJ September survey of economists, with that recorded when Ed Lazear made his famous “no recession” forecast.
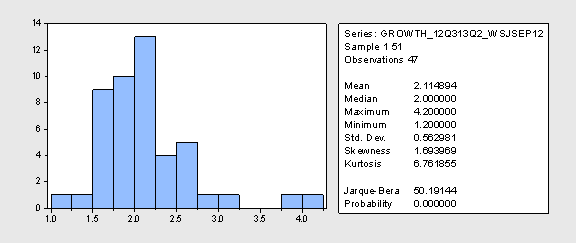
Figure 4: Distribution of forecasts for average q/q growth, 2012Q3-2013Q2. Source: WSJ, September 2012.
Moreover, there is not a single forecast of negative q/q growth in the entire survey. Compare with the May 2008 survey:
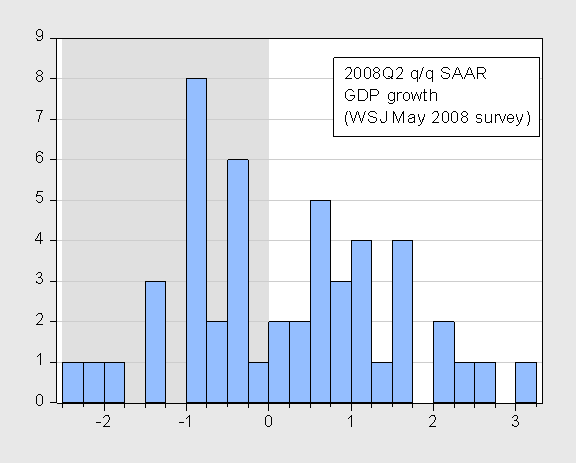
Figure 5: Quarter on quarter SAAR growth forecasts for 2008Q2, from Wall Street Journal May 2008 survey. Source: WSJ, as shown in this post.
So, given the dearth of forecasts of recession, and the fact that not all indicators are trending down, I rate the likelihood of imminent recession as low — but of course the data could be revised down, going forward. Furthermore, crises abroad, or more likely failure to address the fiscal cliff could yet put us in a self-inflicted recession.


Leave a Reply