Some additional observations (see Jim Hamilton’s take, as well as others) on the GDP release: (1) the five year revision indicates that GDP was larger than we thought, but it also declined faster in 2009Q1; (2) GDP growth was lower throughout 2008 than earlier estimated; (3) GDP growth in 2008Q2 at 1.5% SAAR would have likely been at zero or negative in the absence of the January 2008 stimulus package in which case; (4) GDP q/q growth would have been negative from 2008Q1 to 2009Q2; (5) the case that ARRA directly affected 2009Q2 GDP is limited, in a mechanical sense since most of the increase in government spending is accounted for by defense spending; and (6) the US ex-oil ex-agricultural net exports to GDP ratio is back to where it was in 1998Q1.
Just a recap: the -1% GDP q/q SAAR growth came in above the -1.6% growth predicted in the early-July WSJ survey (see here), but below the Bloomberg consensus of -0.7% reported a few days before the release.
The log level of GDP, as reported in the final 2009Q1 and advance 2009Q2 releases, is depicted in Figure 1. According to the revisions, GDP is now 4% lower than a year ago, in log terms. This is the largest recorded year-on-year percentage decline in GDP in the post-War period.
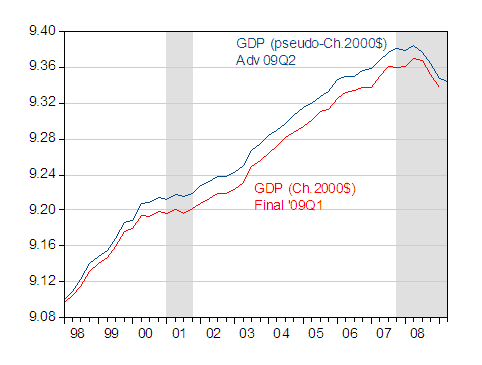
Figure 1: GDP in pseudo-Ch.2000$ SAAR from 09Q2 advance (dark blue), GDP in Ch.2000$ from 09Q1 final (red). NBER defined recession dates shaded gray. GDP in Ch.2005$ converted to Ch.2000$ using ratio of GDP deflators in 2005. Source: BEA 2009Q2 advance GDP release and 2009Q1 final release, NBER and author’s calculations.
GDP larger pre-recession, but shrinking faster in 09Q1
Note that the BEA changed the units in which it measured real output, from Chained 2000 dollars to Chained 2005 dollars. In order to get them in comparable units, I adjusted the series in Ch.2005$ by the difference in deflators between 2005 and 2000. Hence, this is an ad hoc adjustment, which does not fully account for the many differences (see the GDP release for details, as well as NYT).
The major reason why real GDP is higher than earlier estimated is because nominal GDP is higher.
Notice further that while GDP only declined by 1% SAAR in 2009Q2, 2009Q1 GDP growth was revised downward. These revisions are shown in Figure 2.
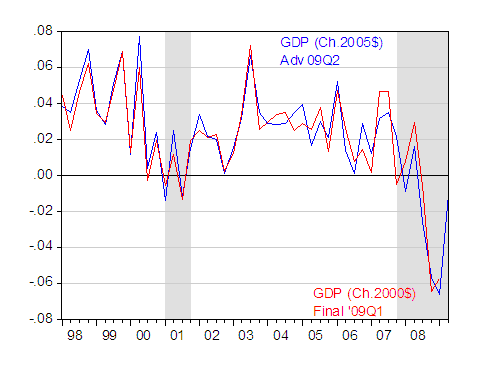
Figure 2: Quarter on quarter annualized growth rates of GDP in Ch.2005$ (blue), of GDP in Ch.2000$ (red). Growth rates calculated as log first differences. NBER defined recession dates shaded gray. Source: BEA 2009Q2 advance GDP release and 2009Q1 final release, NBER and author’s calculations.
The Bush stimulus
With the exception of 08Q2, q/q growth has been negative since 08Q1. Even 08Q2 q/q SAAR growth was only 1.5 ppts. A CBO analysis of the impact of the January 2008 stimulus package indicated that consumption growth was raised about 2.3 ppts in 08Q2. Since consumption is about 70 percent of GDP, then — holding all else constant — then GDP growth was about 1.6 ppts higher (of course, not all else was held constant, but this is good enough for back-of-the envelope). Hence, in the absence of the stimulus, growth would have likely been near zero in 08Q2.
Beware revisions
Let me observe that GDP is a number subject to numerous revisions, and people who make definitive pronouncements about the state of the economy based on advance releases of GDP around likely turning points (case in point discussed here) are likely to be embarrassed in the future. This applies to both maxima and minima; troughs will likely be re-assessed in the future as well. These comprehensive revisions also highlight why the NBER BCDC focuses on four other variables above and beyond GDP.
The impact of ARRA in 09Q2
In terms of contributions to growth, there’s been some discussion of how the stimulus package has, or has not, had an impact on 2009Q2 growth. In mechanical terms, it’s hard to see an impact. First, as indicated in this post, the cumulative amount spent through June 2009 was only about $60 billion. Second, according to the NIPA definition of spending on goods and services, very little of the growth can be accounted for by Federal nondefense spending [1].
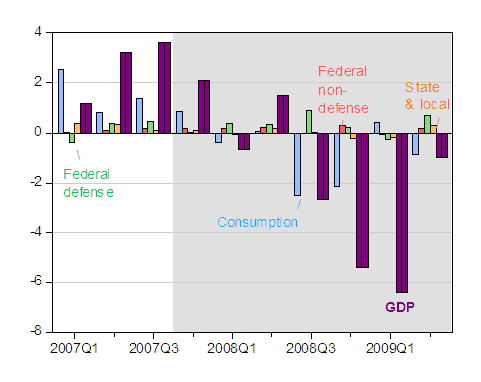
Figure 3: Growth rate of GDP in Ch.2005$ (dark purple thick bar), contribution from consumption (light blue bar), from Federal nondefense spending (dark orange bar), Defense spending (light green bar) and state and local government spending (light orange bar), all in percentage points. NBER defined recession dates shaded gray. Source: BEA 2009Q2 advance GDP release, and NBER.
Even state and local government spending only contributes slightly to growth. I have two caveats here. First, working in the mechanical sense, while state and local spending only contributed a small positive amount (0.3 ppts) in 2009Q2, this is a reversal from 2009Q1 when state and local spending was deducting 0.2 ppts from growth. In the absence of the stimulus bill, state and local spending might very well have continued to deduct from growth, as states were forced to balance budgets.
Accounting is useful, but it’s important to recall Figure 3 presents only an accounting decomposition. Intertemporal considerations come into play, to the extent that households, anticipating higher future income than would otherwise would have occurred. State and local governments probably kept some projects running, rather than shutting them down, with knowledge that funds would be coming in. I don’t want to overstress these channels, but the intertemporal perspective is, in any case, the hallmark of the New Classical approach. (In my view, this effect is likely to be large only if one is a believer that the intertemporal rate of substitution is large and liquidity constraints minor, and I’m not quite ready to go so “New Classical”). I expect the biggest impacts to be in the future (and I, like the CBO, expect those effects to be noticeable).
Tracking trade
The trade balance still seems to be improving, either overall, or when excluding agricultural exports and oil imports. In fact, the latter is back to the levels of 1998Q1.
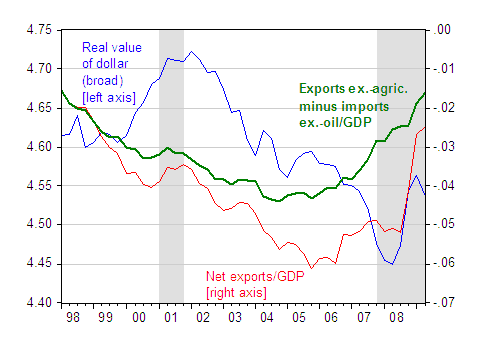
Figure 4: Real value of dollar against a broad basket of currencies (blue, left axis), net exports to GDP (red, right axis) and exports ex.-agric minus imports ex.-oil to GDP (green, right axis). NBER defined recession dates shaded gray. GDP Source: BEA 2009Q2 advance GDP release, NBER and author’s calculations.
That being said, real goods imports (ex.-oil) and exports (ex.-agric.) are still decreasing, albeit at slower rates than before [2]. The reported values for 2009Q2 are based upon only two months’ worth of data, so we’ll have to wait until the preliminary release for a better fix on where trade volumes are going.
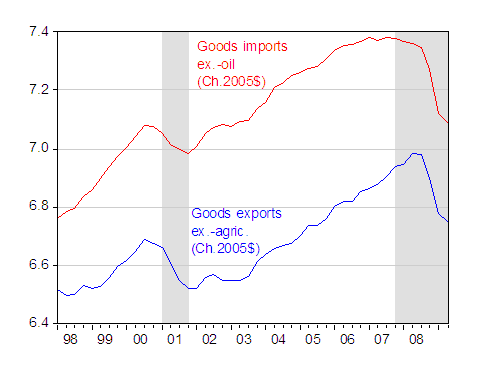
Figure 5: Log exports ex.-agricultural goods in Ch.2005$ (blue) and log imports ex.-oil (red). NBER defined recession dates shaded gray. Source: BEA 2009Q2 advance GDP release, NBER and author’s calculations.
Since exports are still declining, they are deducting (mechanically) from the components of growth. I’ve viewed the sharp drop in trade volumes as a function of sharply declining world output combined with high income elasticities (perhaps due to vertical specialization) and a credit crunch [3], [4]; in contrast Freund believes that the dropoff is explicable in terms of elasticities. How fast trade volumes bounce back depends upon the importance of each factor, and the pace of resolution of the credit crunch [5].
Good News and Bad News from the GDP release
Disclaimer: This page contains affiliate links. If you choose to make a purchase after clicking a link, we may receive a commission at no additional cost to you. Thank you for your support!


Leave a Reply