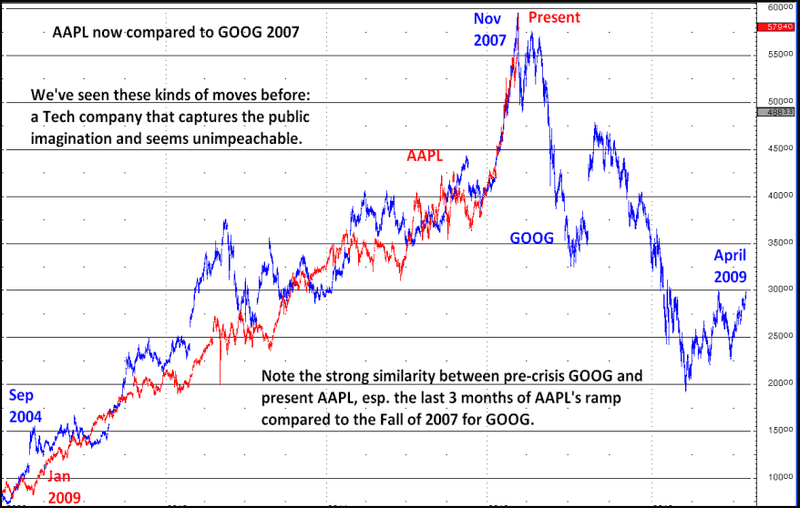
I was day-trading Google (GOOG) around 2007 when it went parabolic and then fell like a rock. A warning shot for what happened to the market in 2008. Been playing with Apple (AAPL) in a similar way, and just saw it go parabolic. Is history repeating? First the collapse of AAPL and then the whole market? Check this chart out from Doug Kass:
(click to enlarge)
I have seen a lot of commentary on this chart. “This time it is different!” GOOG was at a 50 PE while AAPL has drifted to a PE that is the same as the whole S&P (which makes sense given its market cap size – “regression to the mean” – It IS the mean now!). AAPL is still growing fast and has continued dominance of its sectors. Etc.
Stock predictions range from a low of $450 to a high of $750, with whisper at $1000, which would value AAPL at close to $1T.
Now, I am an Apple fanboy, and use my iPad and iPhone 4S constantly, eschewing my Android phone (Google Nexus – you get it, prior Google fanboy until the stock popped), hardily touching my Windows netbook, and sitting in front of an iMac dreaming of a Macbook Air with a touch screen. But I am buying a stock, not a company.
That stock has produced. Looking back, it got to as low as $3.18 in 1997-8, while generally hovering below $5. Bill Gates bailed out Apple for $150M back then. if Microsoft had held that stake, it would be worth over 100x – over $15B. Microsoft also bought into Facebook in 2008, and that stake will be worth a lot too, but the AAPL return is truly outstanding.
Parabolic runs always end badly, typically with a fall off a cliff shape. When GOOG fell, it had the expected bounce (wave 2) and then fell hard – look at the chart. But parabolic runs have no clear rules. AAPL may keep running. There are a bunch of stock market aphorisms around this, including don’t get in front of a moving freight train.
One way to figure this out is to use technical analysis. Here is a wave chart on AAPL, which says the recent tick at $600 could very well be the end:
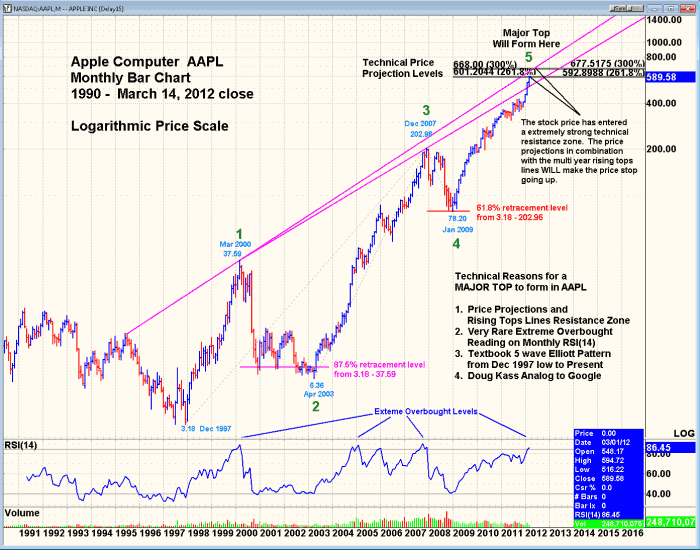
(click to enlarge)


Don’t forget that in 2008 every stock went down the tube due to the financial crisis.
I’m riding AAPL to 750. Good luck everyone else.
This is not an honest article. The drop in Apple stock in 2008 was the result of hedge funds selling their most liquid stocks due to being called on margin.
I like technical analysis but if this is the top it surprises me that the stock didn’t correct but 15 dollars prior to the Ipad launch.
I can’t predict stocks nor tops nor bottoms. I just can’t believe this got published.
“Parabolic runs always end badly, … parabolic runs have no clear rules.”
Uhm, so which is it, they always end badly, or they have no clear rules, like they always end badly?
Why look at a chart without any context? What was going on at that time macro economically? How did the baseline Dow or Nasdaq do at the same time?
I went to look at Google from Nov 9, 2007 to April 9, 2009, and while Google fell 47.6%, the Nasdaq fell 41.2% and the Dow 40.5%. Google has a beta of 1.08, so, the fall in Google is perfectly in line with the market, given its slightly above average beta.