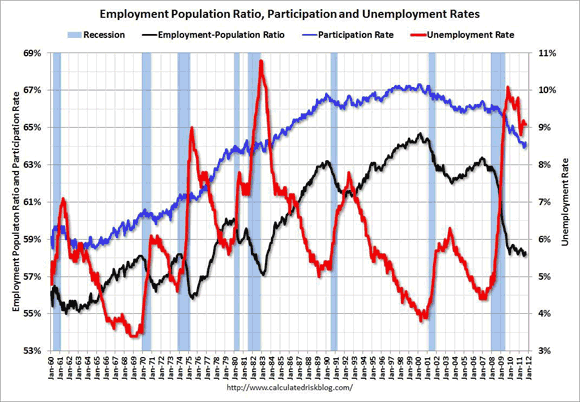
While the unemployment rate (9.1% in September, unchanged on the month and down from 9.6% a year ago) gets the headlines, it is worth digging just a little bit deeper into that number. The unemployment rate is really the civilian participation rate divided by the employment rate, also known as the “employment population ratio.”
The total population (over 15 years old) is divided into three groups: the employed, the unemployed and those not in the workforce. The participation rate (blue line in the graph below) is the percentage that are either employed or unemployed. It will never reach 100%. For that to happen, the social security retirement age would have to be raised not to 67 or 68, but to 167.
The highest the participation rate ever reached was 67.3% in April of 2000. The participation rate will normally slump during a recession and its aftermath.
However, as the graph below shows, the participation rate was in a huge secular increase from the mid-1960’s until the end of the 20th century. Yes, it would flatten out and decline slightly during recessions, but it would always return to a higher high, and the low during the next recession was always much higher than the previous low.
That did not happen in the last expansion. The highest the participation rate hit during the last expansion was 65.8% in January 2005. In July, the participation rate fell to 63.9% from 64.1% in June, and hit its lowest level since 1983. We have climbed back a bit over the last two months, rising to 64.0% in August and 64.2% in September. It had been at 64.2%, for most of the first half of the year, but generally has been trending downward. It was 64.7% a year ago.
The employment rate fell to 58.1% in July from 58.2% in June, also a low since 1983. It is now back up to 58.3%, up from 58.2% in August, but down from the 58.5% rate of a year ago. The employment rate is a very underappreciated economic statistic and really should be much more widely reported.
Downward Pressure to Continue
The front end of the baby boom is just now hitting retirement age, and that will put continuing downward secular pressure on the participation rate for years to come. The participation rate had been steady at 64.2% in the first half of 2011 before dipping in June and July, but has returned now to the levels of earlier this year.
A rising participation rate will put upward pressure on the unemployment rate, but should nevertheless be considered to be good news. A falling participation rate will lower the unemployment rate, but is bad news for the economy.
We should be seeing the participation rate rise, not fall, two years after the official end of the recession. It is still below the year-ago level of 64.7%. Over the longer term, though, the rebound in the participation rate is likely to be limited by the baby boom retirement wave.
Employment-to-Population Ratio
The other side of the decomposition of the unemployment rate is the employment to population ratio, or the employment rate (black line). That is the percentage of the population that actually has a job. One way or another, these are the people that have to support the rest of the population.
This is a hugely under-reported number, and one that deserves a lot more attention than it gets. Like the participation rate, it had been in a secular upward trend from the mid-1960’s through the end of the century. It is, however, much more volatile than the participation rate (it has to be — if it always moved in tandem with the participation rate, the unemployment rate [red line, right hand scale] would never change).
Its high water mark was 64.7% in April 2000. Unlike previous recoveries, it never came close to hitting a new high after the 2001 recession was over, only getting back to 63.7% in March of 2007 before starting to fall again. During the Great Recession it really fell off a cliff, hitting 58.2% early in 2010. It erratically pushed its way higher through the middle of 2010, but then collapsed back to 58.2% in November.
July set a new low that has not been equaled since November of 1983. The rise over the last two months is very encouraging, but has to be seen in the larger historical context. (Graph from this source).
Better Than the Last Two Times
Note that in the 1991 and 2001 recessions, the employment rate (employment population ratio on the graph) continued to decline for a very long time after the recession ended. The NBER declared the Great Recession officially over as of June 2009.
You would never know it from listening to the press or the pundits, but this recovery has been better on the jobs front than the two recessions that preceded it, particularly when it comes to private sector employment. However, both of those recoveries were far slower than all of the post war recoveries that preceded them.
The employment rate should get more attention than it does, and the unemployment rate less, although clearly the two numbers are related. The unemployment rate though can be more subject to distortions than can be the employment rate. Over the last year, most of the decline from 9.6% unemployment to 9.1% has been due to the drop in the participation rate, and was thus an illusion.


Leave a Reply