At times like these I’m glad I’m not in Paul Krugman’s shoes. Here Krugman discusses the fact that inflation isn’t declining, even though NK models say it should decline when there’s lots of slack in the economy:
That said, is inflation running higher than I expected? Yes. Am I worried that this might be the beginning of a runaway inflation process? No. Do I sound like Donald Rumsfeld? Yes.
The IMF study of PLOGs — prolonged large output gaps — pretty much summarizes my own views. You expect a persistently depressed economy to have falling inflation, although it tends to level out at a small positive number. There can be episodes of rising inflation along the way, however, but these normally reflect special and temporary factors, usually oil prices and/or currency devaluation.
US experience mostly fits this pattern, although I now believe that there’s an additional special factor that isn’t typical: the prolonged slump in home construction has now created a bit of a shortage, so rents are rising — and since implicit owners’ rent is a major part of core inflation, that’s causing a pickup over and above the effects of oil prices.
Sometimes people ask me why I focus on NGDP, rather than RGDP and inflation, like a normal economist. From the beginning I’ve been arguing that inflation is a pretty meaningless number, or at least it doesn’t mean what we tend to assume it means–the change in the price of goods and services produced by American labor. Most economists understand the imported oil bias, but housing is a much larger share of the CPI (roughly 1/3, and even higher for the core.)
Question: What’s happened to American housing prices over the past 5 years?
Answer: According to Case-Shiller they’ve fallen by 31.6%.
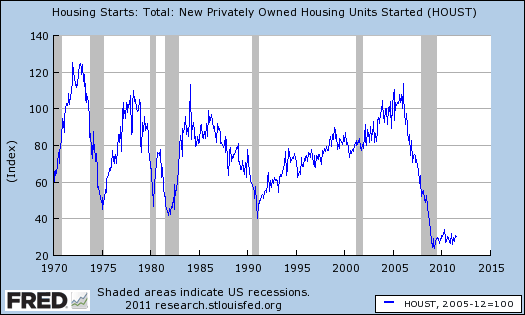
Question: And what’s happened to housing construction over the past 10 years?
Answer: According to this graph provided by Matt Yglesias, housing construction has been unusually low during the past 10 years, when compared to previous decades.
That sounds a lot like an adverse demand shock. Yet many continue to insist we built too many homes, even though that would lead to quantity and prices moving in the opposite directions, not the same direction (never reason from a price change.)
So why is housing causing a problem for the Krugman model? The answer is simple; the BLS doesn’t agree with Case-Shiller, they don’t agree that house prices fell 31.6%. What kind of figure did the BLS come up with?
Answer: 7.7%
I can just imagine your reaction: “What!?!?!?!?! They claim housing costs only fell 7.7% over the past 5 years! That’s insane.”
I’m afraid you’d better sit down for this. The BLS doesn’t claim housing prices fell 7.7% since mid-2006, they claim they rose by 7.7%. Just a minor 39.3% discrepancy with C-S.
Now I’m sure people will tell me that the BLS uses a different methodology. They look at rental equivalent. But that’s still a pretty big discrepancy.
Now let’s consider an argument frequently made by commenters; real wages are falling, whereas my sticky wage model (supposedly) predicts they should be rising. (Actually it doesn’t.) Consider two brothers, one who graduates from high school in 2006 and makes $40,000. He buys a house for $150,000. The younger brother graduates in 2011 and makes $43,000. He buys a similar house for $100,000. Who’s better off? The BLS says the older brother, because real wages have fallen. And that’s because the cost of living rose by more than the wage rate. But whose shoes would you rather be in?
Now it’s quite possible that the younger generation is worse off than 5 years ago. But not because real wages are falling, rather because they have worse jobs, fewer hours, or are completely unemployed.
The problem with new Keynesian economists is that they believe the government data for inflation, real wages, etc, actually measures the theoretical concepts that the model tries to address. But they don’t. Even NGDP is far from perfect, but at least it’s not as distorted as the CPI.
PS. By the way, the minimum wage has increased 40% since 2006.
PPS. Even the C-S index isn’t the theoretically appropriate price of housing, as it includes land. We’d like to know the change in the price of stuff actually built with US labor, and land isn’t built. Nor is “rental equivalents.”
PPPS. Someone sent me a chart showing that 10 year TIPS spreads in Europe have fallen to 0.6%. Can one of my European readers confirm this stunning data point? Thanks.
Disclaimer: This page contains affiliate links. If you choose to make a purchase after clicking a link, we may receive a commission at no additional cost to you. Thank you for your support!


Leave a Reply