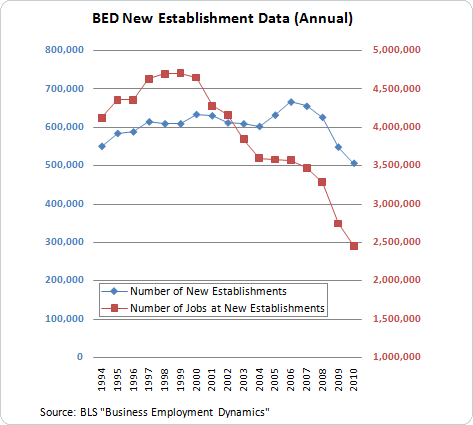
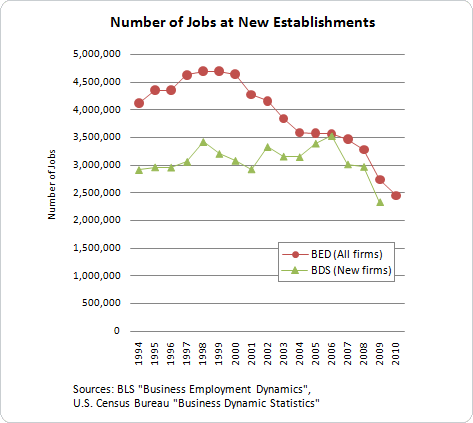
Last week, John Bussey of the Wall Street Journal identified some discouraging statistics from the U.S. Bureau of Labor Statistics “Business Employment Dynamics” (BED) program concerning the number of new establishments (a specific physical location like a store) and the number of jobs from new establishments. These data are replicated in the following chart, which shows both a steep decline in the number of establishments over the last few of years but also a decade-long trend of a declining number of jobs coming from new establishments.
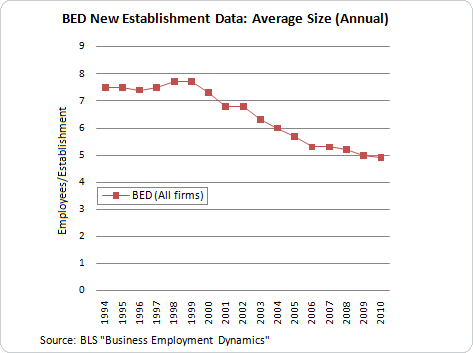
Not only has the number of new establishments declined, but the average size of new establishments has also tended to decline over time.
If small businesses, or more specifically new small businesses, are an engine of job growth in the United States, that particular engine has been getting less powerful. Between March 2009 and March 2010, new establishments generated 1 million fewer jobs than over the period from 2005 to 2007. About 85 percent of that decline was related to a reduction in the number of new establishments. The other 15 percent was attributable to the smaller average size of those new establishments. In contrast, the 1 million fewer jobs per year coming from new establishments between the years 2000 and 2005 were all attributable to a decline in the size of the establishments—the number of new establishments per year actually rose slightly over that period.
The BED program also maintains a quarterly series on establishment births (the annual data are for the year ending in March). The quarterly data show that the number of new establishments rebounded over the latter half of 2010 to a pace comparable to the late 1990s. But the associated number of jobs did not increase proportionately.
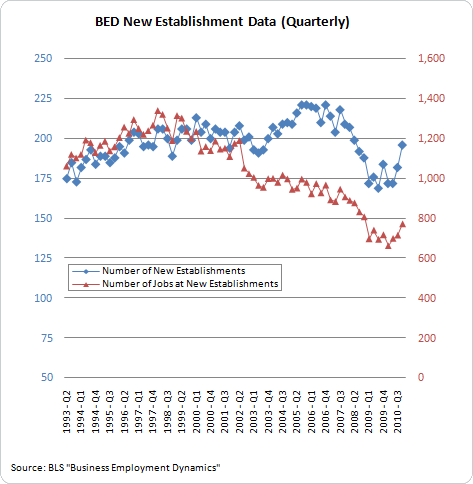
So while there appears to have been a healthy pick-up in the number of new establishments in late 2010, the gradual march toward ever-smaller new establishments seems to be continuing.
The changing industrial composition of the economy doesn’t seem to be the explanation for the declining establishment size trend—the pictures look basically the same if sectors such as manufacturing and construction are excluded. Perhaps it is that new establishments are simply more able than older establishments to adopt new technologies and processes that reduce the demand for labor because they have no legacy employment or capital to deal with.
How robust are these findings? The BED data do have some drawbacks. For example, the BED data are extracted from the administrative unemployment insurance records for businesses that have payrolls (employees). This covers the vast majority of workers in the United States (about 98 percent of employees on nonfarm payrolls and 94 percent of total employment) but not the majority of businesses (U.S. Census Bureau figures for 2006 report that there were about 3.5 times as many firms without employees other than the owner(s) than firms with employees). Also, these data do not distinguish between a new location that is part of a new firm and a new location that is part of a larger multi-establishment firm (like a national chain).
The Census Bureau maintains a related, but different, data set—the Business Dynamics Statistics (BDS)—that allows distinguishing between new firms and new establishments. However, the latest publicly available data only go through the year ending March 2009. The BDS data for new establishments from new firms and the jobs from those new establishments are shown in the next chart. Like the BED data, the BDS new firm data show that the number of new establishments peaked in 2006 and has been trending lower since.
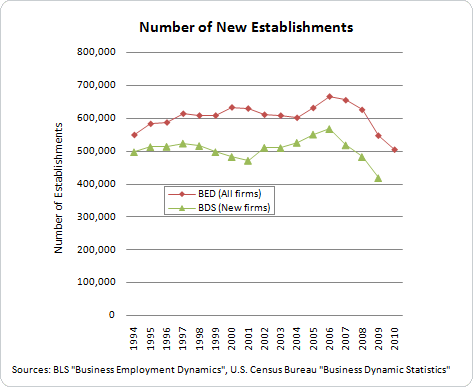
However, the two data sources differ in terms of job creation: the BED new establishment employment data peaked in 1999 and has been declining steadily since, while the BDS new firm employment data peaked in 2006 and was relatively stable prior to that.
Compared to the BED data, the average size of new establishments from new firms in the BDS data has changed relatively little over time—the swings in the number of establishments and employment in the BDS data move about in proportion to each other.
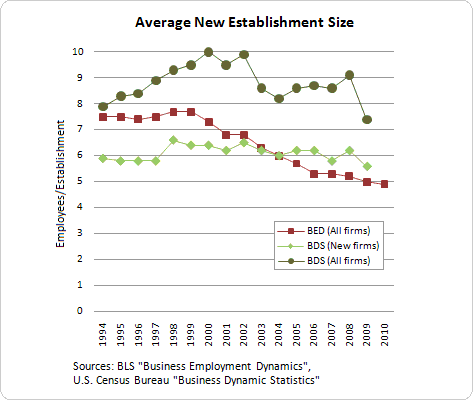
Interestingly, the BDS data on the average size of new establishments at firms of all ages (new firms as well as older firms) appears to be more cyclically sensitive than the new firm data, suggesting that older firms respond more to prevailing economic conditions than new firms do. Neither of the two BDS series displays the secular trend apparent in the BED data over the last decade.
Why do inferences about new establishments from the BED and BDS data differ? I don’t know. This 2009 paper by U.S. Bureau of Labor Statistics economists Akbar Sadeghi, James Spletzer and David Talan tries to reconcile the differences but concludes that a definitive answer would require linking the data series together to compare the measures for matched establishments.
There is plenty of scope for investigating the dynamics of new business formation using data at a U.S. Census Bureau Research Data Center (RDC). The newest RDC will be located at the Atlanta Fed, which has partnered with six other research institutions to apply for and be approved to operate the 13th RDC location in the United States. The Atlanta Census Research Data Center will be a secure location where approved researchers will have access to restricted microdata in order to investigate questions like these. The Atlanta RDC is scheduled to open in September. For researchers in the Southeast interested in exploring research opportunities at the Atlanta Census Research Data Center, contact Melissa Banzhaf. For more information about U.S. Census Bureau Research Data Centers, and the Atlanta Census Research Data Center in particular, see here.


Leave a Reply