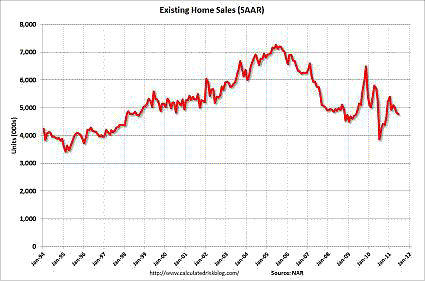
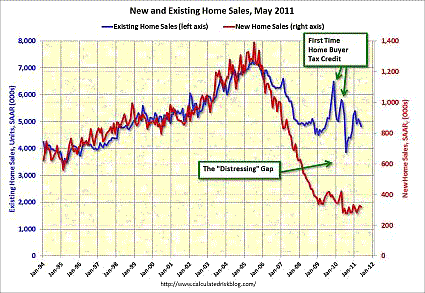
In June, Existing Home Sales ran at a seasonally-adjusted annual rate of 4.77 million. That pace is 0.8% lower than in May, and 8.8% below the year ago rate. The year ago numbers were somewhat inflated due to the end of the homebuyer tax credit. The June sales rate was below consensus expectations of a 4.93 million annual rate. The history of used home sales is shown in the graph below (from Calculated Risk).
Sales of single family homes were unchanged on the month at a rate of 4.24 million, and are off 7.4% year over year. The median price of a single family home nationwide rose 0.6% from a year ago to $184,600. Condo and co-op sales fell 7.0% on the month, and are down 18.0% year over year. The median Condo price rose 1.8% from a year ago to $182,300. For all existing homes, the median price was up 0.8% to $184,300.
Regionally sales were down on the month in two of the four Census regions. All four regions were down year over year. The Northeast fared the worst, with sales down 5.2% for the month and down 17.0% from a year ago. The West had a month to month decrease, with sales falling 1.7%, down 2.6% from a year ago. In the Midwest, sales rose 1.0% for the month but are down 14.0% year over year. The South, the largest of the four regions, saw a 0.5% rise on the month, but a 5.6% year over year decline.
Prices rose in the higher priced areas of the country, and fell in the cheaper areas. The Northeast is the most expensive region, with the median home going for $261,000, up 3.1% from a year ago. The West is also relatively expensive, with a median price of $240,400, up 9.5% from a year ago. The Midwest, already the cheapest area of the nation to live in with a median price of $147,700, saw a year over year decline of 5.3%. Prices in Dixie dropped 0.1% from a year ago to $159,100. The median price is not the best measure of housing prices, as it is affected by the mix of houses being sold. However, the data is consistent with what the better, but less timely, measures (such as the Case Schiller index) have been indicating. The median price is not seasonally adjusted.
The level of activity in used home sales really is not that important in isolation. It is just the transfer of an existing asset, and does not add a lot to economic growth. The one exception to that is Realtors’ commissions. Indirectly, it can help as people will often remodel and redecorate a “new for them” house. That can stimulate some sales for paint companies like Sherwin Williams (SHW) and perhaps it is good for furniture firms like La-Z-Boy (LZB), but it pales compared to the economic activity generated by a new home sale.
New homes not only need new paint on the walls, but they need the walls. That means lots of business for wallboard firms like USG (USG), timber firms like Weyerhaeuser (WY) and roofing and insulation firms like the Johns Manville division of Berkshire Hathaway (BRK.B). It also means that those firms have to hire more workers, so the employment effect of new home sales goes well beyond the roofers and carpenters actually on the jobsite. Also, the newly employed Construction workers will have money in their pockets to spend, and as they do, that will stimulate other jobs.
Where used home sales are important is in relation to the inventory of houses for sale. That will influence the future direction of housing prices. Used home prices are extremely important. As used home prices fall, more and more people find themselves underwater on their mortgages. As long as a homeowner has positive equity in their house, the foreclosure rate should be zero.
After all, it is better to simply sell the house and get something for it, rather than let the bank take it and get nothing for it. The more people under water, and the deeper they are, the higher foreclosures and strategic defaults are going to be. A strategic default is when someone has the cash flow available to continue to make his mortgage payment, but simply decides not to, since paying is a just plain stupid thing to do from a financial perspective. If you have a house that could only sell for $150,000 in the current environment, and you owe $200,000 on the mortgage, in effect you have the option of “selling” the house to the bank for $200,000 simply by not writing the checks. Of course that will be a hit to your credit rating, but $50,000 is probably worth a bit of a tarnish on your Fico score. If the difference is only $5000, then the hit to your credit score makes less sense, and there are lots of non economic factors (a house is after all a home, not just an investment) that come into play.
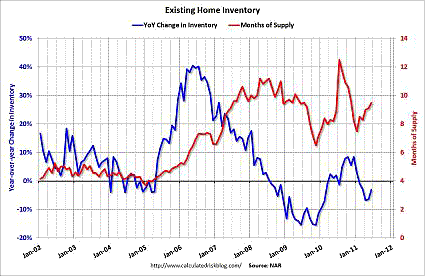
In June, inventories rose by 3.3% to 3.77 million. Combined with the slight fall in sales, that puts the months of supply at 9.5 months, up from 9.1 months in May, but below the record 12.5 months set a year ago. It is still a very high level. A “normal” months of supply is about six months, and during the housing bubble just over four months was the norm. Also, the inventory numbers are not seasonally adjusted, even thought here is a seasonal pattern when they tend to decline in the winter (especially around the holidays) and then increase in the spring.
The second graph (also Calculated Risk) traces the months of supply and the year over year change in inventory. The level still suggests downward pressure on existing home prices over the next few months. The inventory numbers (and hence the months supply) are not seasonally adjusted, and there is a tendency for inventory levels to rise in the spring. The year over year drop in inventory is somewhat encouraging, but the level of inventories has to be viewed relative to the sales pace.
Fortunately, relative to incomes and rents, home prices are not as absurdly overvalued as they were then, so the magnitude of the coming price declines is likely to be a lot less over the next year than the 30% plunge in 2008 and early 2009. I suspect they will fall by about 3% from here, and will probably bottom out by the end of the year. Still, that could do a lot of damage, since the equity cushions are a lot smaller now than they were in 2007 or early 2008.
If housing prices fall more than 3%, then lots of people with razor thin current positive equity will also be underwater, and lots of homes that are only slightly underwater (where non financial considerations tend to dominate) will become deeply underwater. There are some very well respected housing economists, including Robert Schiller (creator of the Case Schiller index) who are far more pessimistic than I about the future of housing prices, thinking prices could drop 20% or more from current levels. That is possible, especially if the austerity mania that is sweeping Washington results in a substantial slowing of the overall economy. That now seems very likely. If the debt ceiling is not raised, the economy will not slow, it will collapse. In that case, Dr. Schiller is a giddy optimist on housing prices. However, barring such a scenario in Congress, we will probably muddle through for the rest of the year, as the waning of temporary drags like the effects of the Japanese Tsunami help offset the drag from fiscal austerity.
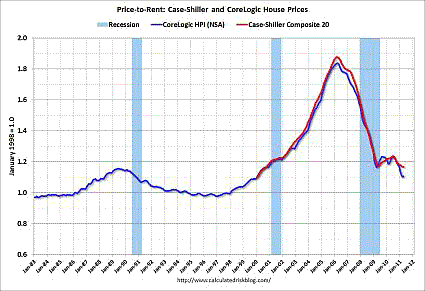
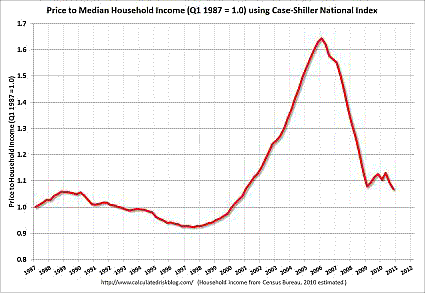
The next two graphs (also from Calculated Risk) track housing prices relative to the two most important drivers of housing prices: rents and incomes. My forecast of a further 3% decline would put prices roughly in the middle of the range where they were in the 1990’s. Dr. Schiller’s would put housing prices at the very low end of that range. I would say the risk is more that Dr. Schiller has it right, rather than we are both wrong (and him very wrong) and housing prices start to rebound in the near term. I would also note that apartment vacancies have been declining recently, which will likely lead to increases in rents; this would tilt the rent vs. buy decision in the favor of buying.
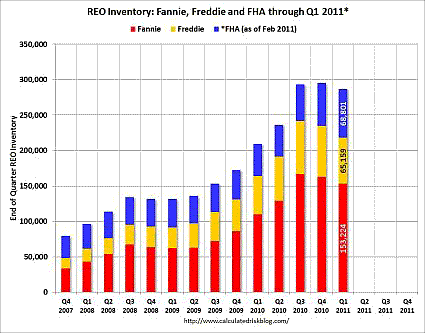
However, with falling home prices it is likely that the pace of foreclosures will pick up again. Even with the slowdown in foreclosures, the number of homes that are now owned by Fannie, Freddie and the FHA is mounting as can be seen in the next graph (again from Calculated Risk). Those institutions have no use for those homes and they will go on the market, often at very aggressive prices, putting downward pressure on the market. Most of those that are being foreclosed on have indeed fallen far behind in their mortgage payments, and so in that sense the foreclosures are legitimate, even if the paperwork is a mess. The combination of underwater homes and reduced cash flow from one or both of the breadwinners in a family being out of work is a toxic mixture for the health of not just the housing market, but the economy as a whole.
This was a weak report. The monthly in inventory was worrisome. A 9.5 months of supply is very disturbing and points to continuing downward pressure on existing home prices. The huge glut of existing homes on the market, and the shadow inventory of homes that is likely to be foreclosed upon and thus come to market in the near future, means that we really have very little need to build new homes. Thus residential investment, the historical prime locomotive in pulling the economy out of recessions, will stay derailed.
While we got a bit of a bounce in housing starts and building permits last month, the strength was mostly in the very volatile multi family segment, and the overall level is still extremely depressed. The jobs not created by a rebound in housing construction will mean that household formation will stay depressed, thus further depressing the demand for housing. To put that in more concrete terms, young adults will not be able to get a job and form a family, instead, they will continue living in mom and dad’s basement, rather than soak up the existing housing inventory. A nasty chicken and the egg situation.
The most important part of this report is what it says about the future direction of home prices. There the news is still bad, and at the margin, getting worse. In terms of economic activity and growth, the far more important report, New Home Sales, comes out on Thursday. New home sales have been slammed much harder than existing home sales.
In normal times, there is about a 6:1 ratio between existing and new home sales. In May, that ratio was 15.7 to 1. I don’t expect much of a bounce in New Home Sales, and they well remain at near record lows. I suspect it will be a long time (perhaps until 2015 or so) before we return to that historic 6:1 ratio. Still, that would imply an annual rate of new home sales of 795,000 based on the current level of used home sales, even over a four year recovery period, which still works out to a very strong compounded annual growth rate of 45.4%. That will be an important factor in overall economic growth going forward.


Leave a Reply