As Stephanie Kelton has recently published two excellent pieces explaining the sector balances in the context of government “belt tightening” (see here and here), a logical next step is to present this in the sector financial balances model of aggregate demand. This post will only briefly review that model before applying it to austerity policies; those desiring more complete background can find it here, and a printable version here. Posts by several others describing various aspects of the model are also linked to therein.
Stephanie concludes her first piece with the following:
“This is not rocket science, but it appears to befuddle scores of educated people, including President Obama, who said, ‘small businesses and families are tightening their belts. Their government should, too.”’ This kind of rhetoric may temporarily boost his approval ratings, but the policy itself will undermine the efforts of the very families and small businesses that are trying to improve their financial positions.”
My ultimate goal here will be to graphically demonstrate her point.
The sector financial balances model of aggregate demand (hereafter referred to as the SFB model) is based on the same basic macroeconomic accounting identity explained in Stephanie’s posts:
(1) Domestic Private Sector Net Saving = Government Sector Deficit + Current Account Balance
We prefer this particular arrangement of the accounting identity because it recognizes that the financial flows in the economy are a closed system—one sector’s surplus/deficit is by accounting identity offset by the opposite for another sector or a combination of the other two. This is represented visually by Figure 1 below.
Figure 1: Financial Flows in the Economy Across Sectors
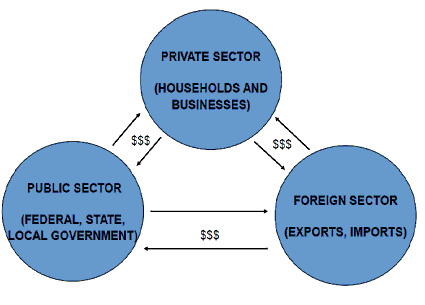
Note that “net saving” for the domestic private sector refers to the outlays relative to income for the entire sector; where income is higher than outlays, the net balance for the sector is increasing and we say the sector has “net saved” or “deleveraged,” and vice versa where the opposite is the case (i.e., “net dissaved” or “leveraged”). Monitoring the relative movements in the three balances over time has been shown in numerous MMT and Levy Institute publications during the past 15 years or so to be useful for tracking the economy’s current and projected behavior. For more background, see my earlier post linked to above.
The SFB model isolates the government and non-government sectors, so the equation is rearranged:
(2) Domestic Private Sector Net Saving – Current Account Balance = Government Sector Deficit
Since the current account balance and the capital account balance are by accounting identity the same but opposite sign, this can be rewritten as:
(3) Domestic Private Sector Net Saving + Capital Account Balance = Government Sector Deficit
What this says is that for the domestic private sector to net save, the government sector’s deficit must be larger than any current account deficit (i.e., a negative current account balance) or, equivalently, a positive capital account balance. Again, this is by accounting identity. The significance of this historically is that the domestic private sector (in the US and elsewhere), as currency users (as opposed to currency issuers), in most years and certainly on average attempt to have positive net saving. Negative net saving positions have been shown to be associated with Minskyan financial fragility and also asset price bubbles.
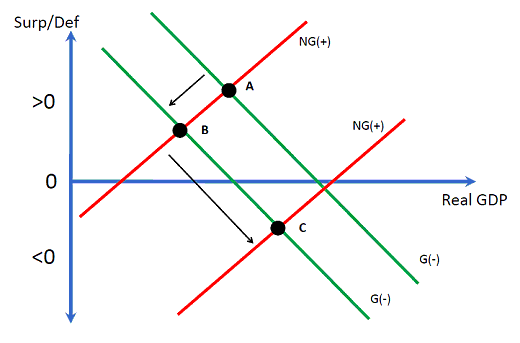
As I’ve linked above to the previous post describing how the model is built, I will simply move on at this point to the model itself, as shown in Figure 2.
Figure 2: The SFB Model
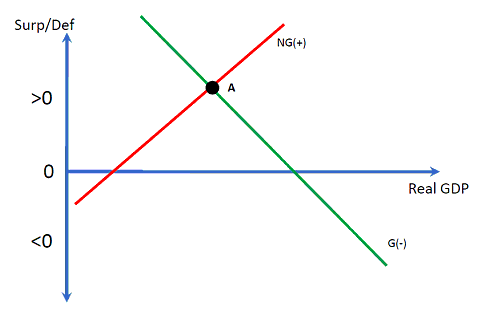
For simplicity, I’ve relabeled the lines as NG(+) and G(-) from the more complex labels in the earlier post. The NG(+) line shows the combined desired net saving by the domestic private sector and the capital account balance at every level of real GDP. That is, from traditional, standard textbook macroeconomic relationships, as incomes (real GDP) rise, domestic private net saving rises and so does the capital account balance (again, explained in more detail in my earlier post and others linked to therein). The G(-) line is the negative of the government’s budget position at every level of GDP; again, it’s standard to recognize that, say, government tax revenues fall as the economy worsens (moving northwest on the G(-) line, while it improves as the economy improves (southwest on the line).
The horizontal axis shows where the balances would all equal zero if the two lines intersected. The “>0” and “<0” on the vertical axis refers to whether NG(+) or G(-) is positive or negative; that is, if the two lines intersect above the horizontal axis, the intersection is in the “>0” space, and the NG(+) and G(-) balances are positive (that is, since the government is running a deficit). Where the intersection is in the “<0” space, the two are negative (that is, the government is running a surplus, as in the negative of G(-)).
Point A in Figure 2 represents the current state of the economy, where the government’s large deficits are mirrored by an even larger domestic private sector balance and a modest current account deficit (see Stephanie’s posts for the most recent data).
Figure 3 shows the path the economy took to arrive at point A. Pre-Crisis, representing the peak of the previous expansion, with a modest government deficit (about 3% of GDP) accompanying small domestic private sector deficits (about 2%) and still larger current account deficits (about 5%). (So, for equation 2, this would be -2% +5% = 3%; the “Pre-Crisis” intersection should probably be a bit higher above the horizontal axis than is shown for the graph to be scaled properly.)
Figure 3: The Path to the Economy’s Current State
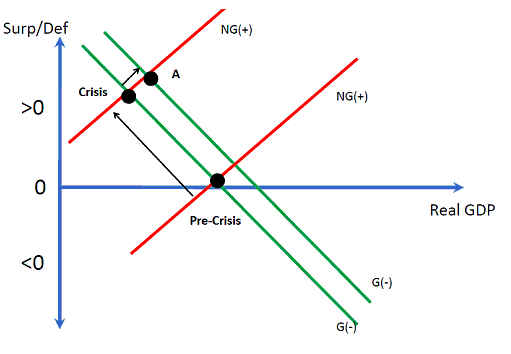
The crisis and deep recession saw a very large shift to the left of the NG(+) line, representing a significant increase in desired domestic private net saving (i.e., reduced desire for the sector to increase leverage as it was during the preceding several years) and an accompanying increase in the government’s deficit (shown in the graph as the move to the “Crisis” intersection). Following the crisis, stimulus measures have shifted the G(+) line to the right to the current intersection at point A, though the economy remains well below full utilization of capacity. The graph is consistent with reports suggesting a significant part of current government deficits are due to the recession, perhaps even more so than being due to fiscal stimulus (though that’s not necessarily important for my purposes here).
Austerity measures such as are currently being planned by US policy makers would have the following effect, ceteris paribus (all else constant), in the SFB model:
Figure 4: Austerity
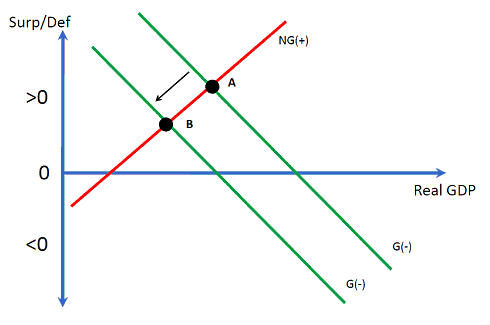
As shown in Figure 4, austerity measures will shift the G(-) line left and thereby improve the government’s budget position at every level of real GDP—again, ceteris paribus—though the actual deficit reduction will only be as large as planned by policy makers if the NG(+) line is perfectly vertical. In reality, it can be expected that the move to austerity—yet again, ceteris paribus—would result in some combination of deficit reduction and reduction in real GDP as the economy moves to point B. How this gets divided up between the two would depend upon the slope of the NG(+) line, which is well beyond the scope of this post.
So, if austerity makes the economy worse off, and the economy is already in bad shape, why do it?
Of course, there are the misplaced concerns about bond vigilantes whose actions could supposedly raise US interest rates in the absence of austerity, thereby shifting the NG(+) further left (as higher rates reduced desired leveraging of the sector) and further worsen the economy now or at some inherently unknowable time in the future. (It should be noted that deficit doves believe this story, too, except they place the inherently unknowable date far enough in the future that austerity is not considered necessary, at least for now.)
But most, including apparently many of our current policy makers, anticipate that austerity will actually improve the private sector’s “confidence” in the economy and thereby stimulate both business investment and household spending. In the SFB model, this is shown as a willingness to re-leverage in the domestic private sector, and thus a shift rightward of the NG(+) line to point C that raises real GDP.
Figure 5: Austerity that Results in Improved “Confidence”
In this hypothesized scenario, austerity could theoretically improve the economy and significantly improve the government’s balance. Of course, to improve the economy to the degree necessary would require that either the domestic private sector balance decreased significantly, even returning to negative rates seen during 1998-2008, or that the current account balance improved that much more than the domestic private sector balance (Stephanie explained this, as well, in her second post). Such an improvement in the current account balance is highly unlikely in the current environment of a global recession and given the austerians’ assumption that the domestic private sector takes off (since some of that increased spending will be on imports).
More importantly, though, is that this scenario—absent a large and highly unlikely improvement in the trade balance—significantly worsens the domestic private sector’s balance while the economy is in the midst of a balance-sheet recession. This was Stephanie’s point in the paragraph I quoted above. Should that scenario come to pass, it would simply put off a (much) worse crisis in the future as the deleveraging required to fix both existing balance sheets of the private sector plus the added debt that would be necessary to expand the economy in the midst of austerity (i.e., by definition the sector’s financial balance would be deteriorating) would be daunting.
Instead, what we might expect to see happen in response to austerity, particularly while in the midst of a balance-sheet recession in which the domestic private sector (mostly the household sector) is attempting to fix balance sheets, is that austerity could be met with still more reductions in desired leverage by the domestic private sector. Households already struggling to avoid bankruptcy and meet payments might now reduce spending even more in the face of reduced spending and layoffs at all levels of government. Businesses, rather than having more confidence, may instead have less confidence that sales will materialize in the near term, and put off more than they have already adding to productive capacity. It would also not be surprising if they shed still more jobs than they already have as a result. This scenario is shown in Figure 6, where instead of a shift right in the NG(+) line, there is a shift left and the economy instead moves to point C’ and goes into a still much deeper recession than in points A or B.
Figure 6: Austerity that Leads to Reduced Private Spending
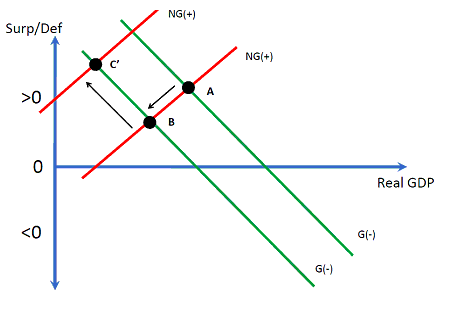
As Stephanie said, a policy of austerity “will undermine the efforts of the very families and small businesses that are trying to improve their financial positions.” In doing so, as shown here, the economy could get worse, much worse.
The response to austerity by the domestic private sector suggested by Figure 6 has led MMT’ers to frequently argue that austerity could actually raise deficits—note that point C’ shows a larger government deficit than exists at point A before austerity is implemented. Figure 6 thus demonstrates the historical analogy frequently raised by Richard Koo, who argues that the attempt by the Japanese government in 1997 to reduce budget deficits in the midst of a balance-sheet recession resulted in larger deficits, not smaller ones. We may be already seeing the same thing in the UK, as deficits there are now growing in the aftermath of austerity measures undertaken late last year.
Overall, particularly given the current balance-sheet recession, the SFB model helps explain why MMT’ers view the government’s budget position as endogenous to the private sector’s reaction to any attempt at austerity, and why we always argue that governments can never directly control their budget positions.
Disclaimer: This page contains affiliate links. If you choose to make a purchase after clicking a link, we may receive a commission at no additional cost to you. Thank you for your support!


Leave a Reply