I have been arguing here for some time that the Great Recession of 2007-2009 was nothing more than a pronounced money demand shock that the Federal Reserve failed to fully offset. As a consequence, nominal spending collapsed and given sticky prices the real economy crashed too. This seems self evident to me and other so called quasi-monetarists (a term coined by Paul Krugman) like Scott Sumner, Bill Woolsey, Nick Rowe, and Josh Hendrickson. Some folks, however, do not buy it. They disagree that the fundamental problem was a money demand shock and by implication they disagree that the Fed could have done anything to offset it. This thinking can be vividly seen in the responses to my National Review article where I make the case for QE2 with a money demand shock story.
A more thoughtful response to my argument comes from Brad DeLong who says rather than a narrow money demand shock being the underlying cause of the Great Recession, it was a broader liquidity demand shock. Thus, the demand for all highly liquid assets increased and derailed nominal spending. Though some of the quasi-monetarists may disagree with him on the details, I think they would agree with DeLong in general and might even call him a closet quasi-monetarist.
So what is the evidence for DeLong’s theory of a great liquidity demand shock? I went to the flow of funds data and looked up the share of highly liquid assets as a percent of total assets for the (1) household and nonprofit sector, (2) the nonfarm nonfinancial corporate business sector, and (3) the nonfarm noncorporate business sector. For highly liquid assets I sum up for each sector currency and checkable deposits, time saving deposits, money market funds, and treasury securities. Presumably, the share of highly liquid assets as a percent of all assets for each sector spiked during the crisis if in fact there was a great liquidity demand shock.
Here is the figure for the households and nonprofit sector:
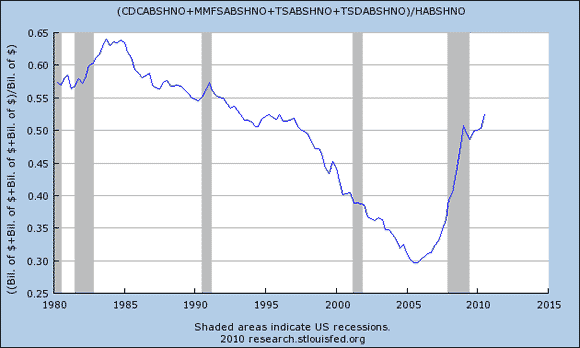
This figure shows that the share of total assets for households and nonprofits allocated to highly liquid assets was declining since the 1980s. This downward trend was dramatically reversed beginning around 2007 and is still elevated.
Next is the figure for the nonfarm nonfinancial corporate business sector:
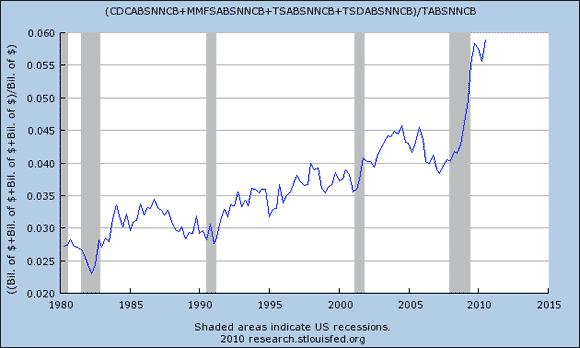
Corporations also saw a spike in their share of highly liquid assets after several decades of very little change. Here too the highly liquid share remains elevated.
Finally, here is the nonfarm noncorporate business sector:
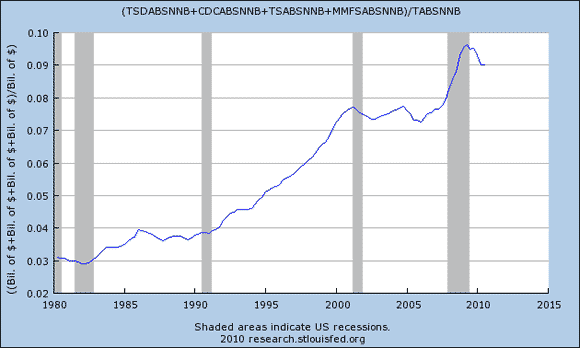
Here too, there is a spike in the share of highly liquid assets. Though the share has gone done slightly, it is still elevated relative to the pre-crisis period.
My takeaway from these figures is that (1) there was a great liquidity demand shock and (2) the Fed failed to sufficiently offset it. Presumably, one objective of QE2 is to bring theses shares back into line with pre-crisis values. The figures indicate, though, there is a long way to go before that happens.
Disclaimer: This page contains affiliate links. If you choose to make a purchase after clicking a link, we may receive a commission at no additional cost to you. Thank you for your support!

Leave a Reply