On November 3, the Federal Reserve announced some new monetary policy measures that have been popularly (if perhaps inaccurately) referred to as a second round of quantitative easing, or QE2. What effects, if any, does QE2 seem to have had so far?
Measures like those announced by the Fed have the potential to lower long-term interest rates. What we’ve observed since the Fed’s announcement has instead been an increase in the 10-year yield of about 60 basis points.
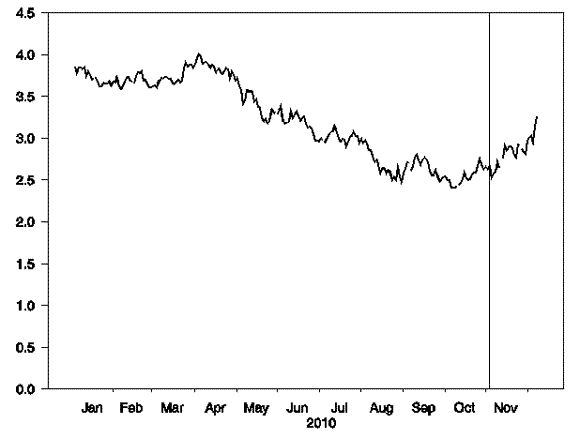
Yield on 10-year Treasury security, Jan 4 to Dec 8. Vertical line denotes Nov 3. Data source: FRED
In my view, the mechanism by which QE2 could potentially have an effect on interest rates is by changing the maturity composition of the outstanding supplies of Treasury securities held by the public. In my research with UCSD Ph.D. candidate Cynthia Wu, we found evidence that changes in the maturity composition have historically been associated with changes in the slope of the yield curve, and that policies like QE2 had the potential to lower long-term rates even when the overnight rate was stuck near zero. The particular policy that we looked at was what would happen if the Fed tried to buy up as much debt as it could at the longest end of the maturity structure (that is, greater than 10 years). We estimated that $400 billion in such purchases might lead to a 13-basis-point drop in the 10-year yield.
QE2 as it’s actually being implemented by the Fed turns out to be something a little different. The Fed is buying very little in the way of bonds of 10 years or longer maturity, and is concentrating its purchases instead on securities between 2-1/2 and 10 years.
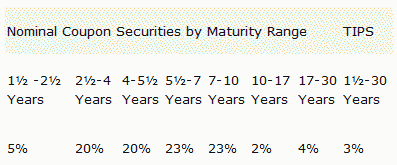
Planned distribution of maturities purchased under the Federal Reserve’s new program. Source: Federal Reserve Bank of New York
Cynthia and I have gone back to our original framework to look at what the effects would be if the Fed were to purchase exclusively 2-1/2 to 10 year securities rather than securities longer than 10 years as we’d originally assumed. Our original estimates are shown in red, whereas the effects of a purchase targeting intermediate securities (in blue) are estimated to be more modest. In fact, whereas our estimated impacts for the first scenario are statistically significantly distinguishable from zero, those for the second scenario are not.
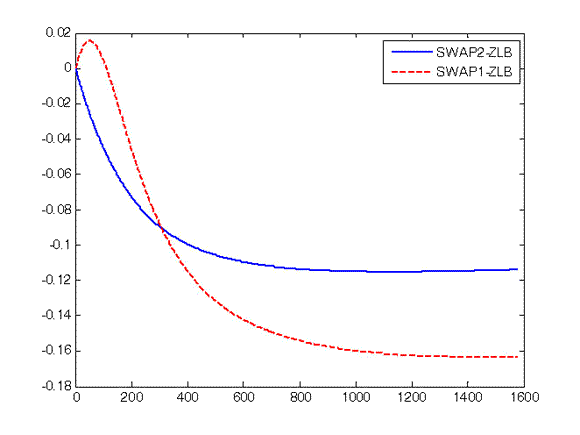
Comparison of effects of purchases targeting different maturities. Horizontal axis: maturity (in weeks). Vertical axis: change in yield for that maturity (in annual percentage points) resulting from proposed change. Red dashed curve: effects of $400 B purchase of securities of 10-year maturity and longer (identical to dashed line in Figure 11 in Hamilton and Wu). Blue solid curve: effects of $400 B purchase of maturities between 2-1/2 and 10 years. Both curves assume the policy is implemented when investors believe that the overnight rate is likely to remain stuck at the zero lower bound for an extended period and that there are no offsetting changes in securities resulting from new Treasury issues
This is also consistent with the finding by Greenwood and Vayanos that the supply of debt of longer than 10 years maturity is a key summary of what matters for the slope of the yield curve.
Moreover, any actions by the Fed are only one determinant of the maturity composition of publicly held debt. A bigger factor can be what is happening with the debt that is newly issued by the U.S. Treasury. To see what has been happening with this factor, Cynthia and I have updated our detailed data set on the maturity composition of publicly held debt to include observations through November of 2010. The graph below summarizes some of the interesting things that we found. The blue line is the average maturity (in weeks) of debt issued by the U.S. Treasury. The green line is the average maturity of publicly held debt, that is, the green line represents the results of subtracting off the Fed’s holdings of Treasury debt. Historically the green line was above the blue. This is because the Fed preferred to buy the shorter-term debt, as a result of which the average maturity of the remaining debt held by the public (green) was bigger than that for the debt as originally issued (blue). However, since the start of 2008, that relation has been reversed– the Fed has been buying a disproportionate share of the longer-maturity debt, and thus has been a factor in reducing the average maturity.
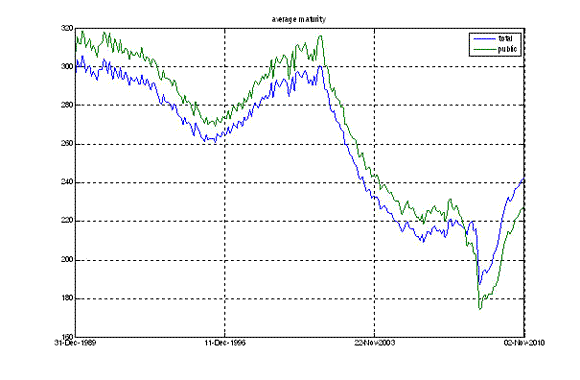
Blue: average maturity (in weeks) of marketable nominal U.S. Treasury debt outstanding as of the end of the month, 1990:M1-2010:M11. Green: average maturity of debt other than that held by the Federal Reserve
But note that, despite the fact that the Fed is buying more long-term debt, the average maturity of publicly held debt has still been increasing sharply since 2009. Over the last year and a half, the Treasury has been issuing new long-term debt much faster than the Fed has been buying it.
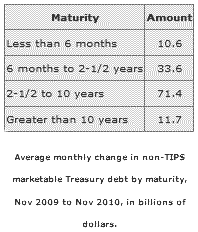 The table at the right reports the average monthly increase in total outstanding Treasury debt for different maturity categories over the last year. It’s interesting to compare those numbers with the size of the announced QE2. The Fed announced that it intends to buy $600 B in debt over an 8-month period beginning in November, or about $75 B each month. But that turns out to be about the size of new monthly issues of debt in the 2-1/2 to 10 year range. So if the Treasury were to continue to issue debt in the amounts and proportions that it has been over the last year, the Fed would only end up absorbing the new debt in this category over the next 6 months, while the amount that is less than 2-1/2 years or greater than 10 years would continue to grow.
We were interested to look at what would have happened if the Treasury behaved just as it did over the last year but the Fed had implemented its proposed QE2 program a year ago. Specifically, we looked at what difference it would have made over the last 12 months if there had been no growth in the 2-1/2 to 10 year debt (because the Fed had bought it all through a QE effort), but the other debt (less than 2-1/2 years or greater than 10 years) had grown at the observed rate. The effect would be that the average maturity of publicly held debt would still have increased over the last 12 months (from 204 weeks in November 2009 to 221 weeks in November 2010). The fraction of publicly held debt that is of more than 10 years maturity would also have increased (from 7.4% to 8.8%).
In other words, given the modest size, pace, and focus of QE2, and given the size and pace at which the Treasury has been issuing long-term debt, the announced QE2 would have been associated with a move in the maturity structure of the opposite direction from that analyzed in our original research. The effects of the combined actions by the Treasury and the Fed would be to increase rather than decrease long-term interest rates.
President Obama’s new proposal on taxes suggests that future new issues of Treasury debt will also be large. News of this proposal was another factor that likely contributed to the rise in interest rates over the last week.
This is not to say that the President’s proposal, or the rise in interest rates that accompanied its public discussion, is a bad thing. I personally believe that the proposal is a good idea, and will generate more significant stimulus than any action that would be within the Fed’s power. I interpret the interest rate response to this news as an overall favorable indicator. We’re not doing what the Fed originally intended. We’re instead doing something with potentially much more power to move the economy.
In any case, the recent rise in yields makes it clear that any effects of QE2 on long-term interest rates, which even in the most favorable analysis appeared to have modest potential, are easily swamped by other changing factors that also matter for yields.
Does this mean that QE2 has been a failure or irrelevant? My answer is no. The primary mission we should ask and expect from the Fed in the current situation is to prevent a replay of the painful wage and price deflation experienced by Japan in the 1990s and by the U.S. in the 1930s. The policy announced by the Fed has persuaded me and many others that the Fed can and will prevent this from happening. I believe that measures like QE2 can be a useful tool for communicating this intention and carrying it out.
And as I’ve said many times before, more than that we should not ask or expect from the Fed.

Leave a Reply