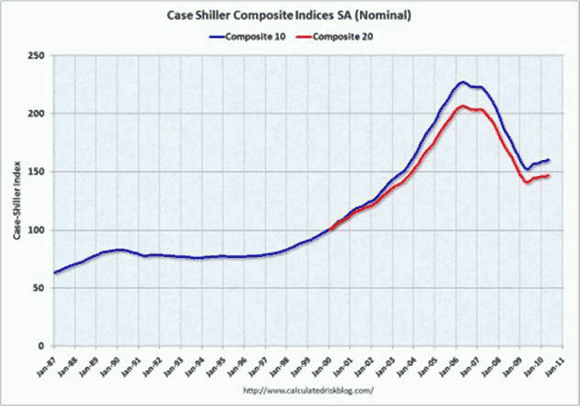
The Case Schiller Home Price Indexes were generally higher in May. On a seasonally adjusted basis (and there is significant seasonality to home prices, so looking at the unadjusted numbers the way that most of the media does is a serious mistake) both the Composite 20 (C20) and Composite 10 (C10) indexes rose by 0.47% for the month. On a year-over-year basis, the C-20 is up 4.63% and the C10 is up 5.44%.
The C10 is a subset of the C20, but has a longer history. The first graph below (from http://www.calculatedriskblog.com/) shows the history of the composite indexes. These are repeat sales indexes, tracking the prices of individual houses as they are resold. As such, they are a much more accurate measure than things like the median price of an existing home, which can be greatly affected by the mix of houses that are selling.
The problem with the Case Schiller index numbers is that they take a long time to come out, and are actually a three-month average. Very useful for historians, but a little bit lacking in telling about current conditions.
Most of the time that would not matter, but now it is significant since we are talking about the price of existing homes, which are recorded at closing. These numbers are still being affected by the homebuyer tax credit. Any transaction that is subsidized by a third party will see the benefits split between the buyer and the seller.
The homebuyer tax credit is a textbook example of a subsidized transaction. People had until the end of June to close on home purchases that were agreed to by the end of April. The first month that will be free of the effects of the subsidies will be July. That data will not be released until late September, and since it is a three-month average, even then will still show some effects of the subsidy. Totally subsidy-free data will not be available until late November.
Housing prices are vitally important. Housing is the key store of wealth for the vast majority of Americans (or at least it used to be before the bubble popped), but it is important to keep the age of the data in mind.
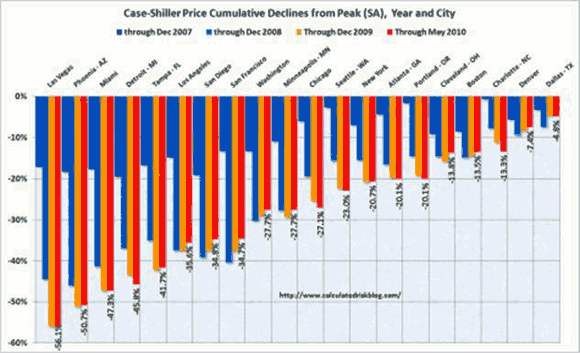
For the month, 15 of the regional markets rose and five fell. On a year-over-year basis 13 markets are up and seven are down. From the April 2006 peak of the bubble, all 20 markets are down, but as the second graph (also from http://www.calculatedriskblog.com/) shows, some far more than others.
The graph is based on the cumulative declines from the peak (actually the individual peaks for each city, which is a bit different from the discussion below, which is based on the decline since April 2006, which was the nationwide peak). Thus if the red line is shorter to the downside than the yellow line (for example, San Francisco), it means that prices have increased in that market since December 2009, even though prices are still well off their peaks.
For the month, the best performing markets were Minneapolis (up 1.15%) and Atlanta (up 1.13%). The three California Markets tracked also did very well, with LA up 0.77%, SF up 0.70% and SD up 0.57%. For the month, the worst performing markets were Charlotte (down 0.85%), Detroit (-0.63%) and Las Vegas (-0.63%).
On a year-over-year basis, California, which was one of the early poster children for the housing bubble bursting has seen some of the best gains. SF is up 18.38% and SD is up 12.48%, taking gold and silver in the yearly housing price race. Minneapolis (actually the Twin Cities, since the data deals with the entire metro areas, not just within the city limits) took the bronze with a 11.69% gain. LA was in fourth place with a 9.79% gain. If it is true that California leads the nation, this is pretty good news.
The worst performing cities on a year-over-year basis were Las Vegas, falling 6.44% and Charlotte, down 2.88%, followed by Detroit, which fell 2.51%. In the early going, Charlotte seemed to be immune to the housing bubble popping (notice how the dark blue bar is almost invisible for Charlotte) but seems to be playing catch up. Still, relative to the top of the bubble, it is still in very good shape, with only Denver and Dallas faring better.
Las Vegas was probably the most “bubblicious” city in the country on the way up and was one of the early casualties, but it is still showing no signs of recovery. Detroit never really enjoyed the benefits of the housing bubble on the way up, but that did not stop housing prices from collapsing. Losing a large percentage of your population will lead to an oversupply of houses and force prices down.
It seems like there is very little correlation between how cities fared early in the housing collapse and how home prices in those areas are doing now. The California cities were just plain awful early on, but now are rebounding strongly. Las Vegas fell apart early as well, and is still rolling snake eyes. Charlotte and Seattle held up well in the early going, but are down 2.88% and 1.44% respectively over the last year, some of the weaker cities. Dallas also held up well early on, but it is showing no signs of catching up to the downside.
Relative to rents and incomes, housing prices are now about in line with the long-term historical averages rather than being wildly out of line to the upside as they were a few years ago. That does not mean that they cannot overshoot to the downside (they are, in line with history, not particularly cheap).
The current bounce we are seeing in housing prices is certainly good news, but it is artificial, propped up by extraordinary interventions in the housing market by the government. That includes the effects of the homebuyer tax credit, which is near its peak impact in the current set of numbers, the impact of the Fed buying $1.25 trillion of mortgage-backed paper.
And, quite frankly, the losses being suffered by Fannie (FNM) and Freddie (FRE), which are now 80% owned by you and me as taxpayers, are effectively a subsidy to the housing market that has helped to prop up prices. The Fed is no longer buying mortgaged-backed paper, and the tax credit is over. It is highly likely that the rise in home prices is over as well, but given the lags in the data, it might not fully show up until this fall.
Housing in Tough Shape Despite Assistance
The recent rise in prices may bring the number of homeowners who are underwater on their mortgages down, but despite the massive government intervention recently, almost 25% of all houses with mortgages were underwater. Owning more on your house than it is worth is probably the single-best predictor of a house being foreclosed upon. It is, in fact, a necessary condition for a foreclosure (or incredible stupidity on the part of the homeowner).
It is, after all, better to sell the house and get something for it than let the bank take it and get nothing for it. If the house is worth more than the mortgage, that option is always open to the homeowner. If the house is deeply underwater, the economically rational thing to do is to stop paying the mortgage and wait for the sheriff to show up at the door.
The other option, which does less damage to the credit rating, is to work with the bank and arrange a short sale where the house is sold for less than the amount of the mortgage, but you don’t have to bring a check with you to closing to pay off the balance. It is worth noting that such ruthless defaults are far more common among the rich with million-dollar mortgages than they are among the working class with $100,000 mortgages. These are standard business practice in commercial real estate.
There are clearly non-economic factors that affect the decision to stop paying on the mortgage. Some people feel that it would be dishonorable to do so (as noted above, working class stiffs are more likely to feel this way than are the affluent, who are more likely to see it as just a losing investment).
Also, a house is a home, and people have strong ties to their neighborhoods and don’t want to force their kids to change schools. People value things like the little marks on the walls showing the kids heights at each Christmas and birthday. Those are the things that have kept the number of ruthless defaults far lower than they “should be” on a strict economic analysis.
Forecast: Bleak
I suspect that housing prices are going to start to fall again, and as they do, companies across the mortgage complex are going to be hurt again. The mortgage insurers like MGIC (MTG) and PMI Group (PMI) are particularly exposed, but they are not alone. A renewed decline in the price of houses will lead to greater losses at Fannie and Freddie, which means the U.S. government will absorb some of the pain.
There is also the housing wealth effect to consider. If the price of you home goes down, you feel less wealthy, even if you still have substantial equity in your house. As a result you will tend to save more and spend less. Generally, the housing wealth effect is estimated at between $0.05 and $0.07, which is greater than the wealth effect from the stock market (because house prices move more slowly than stock prices, and thus the changes in wealth are more likely to be seen as permanent).
In other words, if your house loses $10,000 in value, on average you will spend between $500 and $700 less in the following year. When that happens to tens of millions of families, it starts to have a real effect on consumer spending, and consumer spending makes up 71% of the economy. A renewed decline in home prices would not just affect the obvious retailers like Home Depot (HD), but the entire spectrum of retailers, with those that specialize in more discretionary items — for example, a furniture store like Ethan Allen (ETH) — suffering more than those that focus on staples like supermarkets such as Kroger’s (KR).
Housing was the key reason for the Great Recession happening, and it remains the key reason for the anemic expansion. Today’s news is positive in the short term, but the odds are that it will not last.

Leave a Reply