One of the key functions of labor markets is matching firms looking for workers who have particular attributes (or skills) with individuals looking for work who have those attributes. What economists have been worrying a lot about recently is the potential for a substantive mismatch between the skills of those looking for work and the skills that firms want. This type of labor reallocation friction is one of many potential structural problems affecting the U.S. labor market at present (see, for example, here, here, and here).
A 2003 New York Fed article by economists Erica Groshen and Simon Potter examined the issue of structural rigidities in labor markets during the recovery from the 2001 recession. Their idea was to identify the share of employment in industries that had either continued to lose or gain jobs on net after the recession versus the share of employment in industries that had responded cyclically (gaining jobs after having lost them during the recession or losing jobs after gaining them during the recession) to the recession. The New York Fed researchers used industry of employment as a proxy for industry-specific skills, though it’s not a perfect measure. For example, the skills of construction workers are generally different from the skills of health care workers. The more often that employment is accounted for by industries that are continuing to gain or lose employees, the more the potential exists for skill mismatch going forward.
Using the first 12 months of the recovery as a basis, Groshen and Potter found that in the 1974–75 recession and the recessions of the early 1980s the share of employment in industries continuing recession employment trends was around 50 percent. That share increased to 57 percent for the 1990–91 recession and rose sharply to 79 percent for the 2001 recession. The researchers took these findings as evidence of structural change playing a more significant role in influencing the labor market recovery from the 2001 recession than earlier recessions saw.
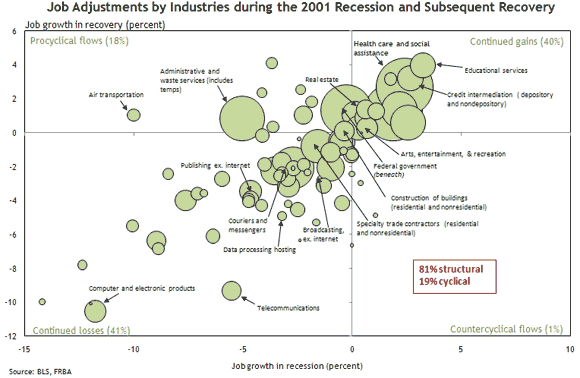
Visually, this observation can be presented as a four-quadrant “bubble chart” that measures job growth during the recession on the horizontal axis and job growth in the first 12 months of recovery on the vertical axis (the size of the each bubble reflects the relative employment size of the industry). We replicated Groshen and Potter’s work with minor data definitional changes and find that for the first 12 months of recovery from the 2001 recession 81 percent of employment was in industries continuing recession employment trends (the top right and bottom left quadrants in the chart).
Using the same approach as Groshen and Potter, how does the 2001 recession compare with the most recent recession? To make that determination, we used data available from the 11 months of recovery coming out of the most recent recession (assuming the recession ended in June 2009). We calculate that 65 percent of employment is in industries either still losing or gaining jobs. This share is less dramatic than the 2001 experience but a bit more than the 1990–91 experience.
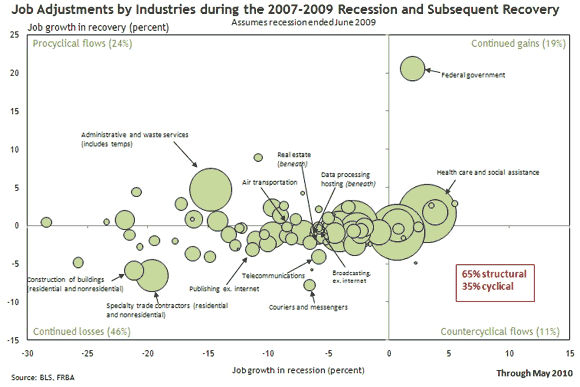
The positioning of certain industries within the four quadrants is not too surprising given the nature of the most recent recession. For instance, construction and related industries are deep in the continued job-loss quadrant. In contrast, the temporary help sector has behaved procyclically. Jobs in federal government and health care have continued to grow, with the former boosted by temporary hiring of census workers. Of the 79 industries examined, about a third of them have landed in a different quadrant compared with the 2001 recession.
Of particular interest is the share of employment in industries that are continuing to lose jobs. For unemployed workers from those industries, there is less prospect of being reemployed in that industry and hence a greater chance that skill mismatch will be an issue for those workers. Interestingly, the share of employment in industries experiencing continued net losses is similar to that seen during the 2001 recession (45 percent versus 41 percent).
This most recent recession was especially deep, and the large share of unemployed workers reporting they were permanently separated from their employers suggests that many of those jobs in all likelihood will not come back. If new jobs come with different skill requirements, then skill mismatch could become a significant factor once labor demand increases. However, the relatively disappointing May private-sector payroll jobs numbers released last Friday and the improving but low level of job openings reported in the JOLTS data for April are reminders that weak labor demand is still the dominant factor inhibiting the overall employment recovery.


Leave a Reply