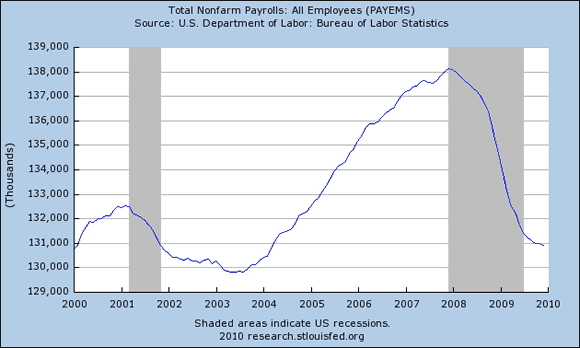
There have been approximately 7.2 million jobs lost–as measured by total nonfarm payrolls–in the United States since the start of the recession in December 2007. This is same number of jobs the U.S economy had back in March 2004. This staggering reversal in employment can be seen in the figure below:
The total 7.2 million jobs lost can be broken down into the following industries:
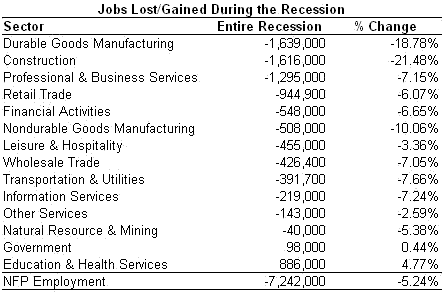
Note that the education and health care industries have actually gained jobs during this time. Finally, it is useful to take a look at the cumulative % change in jobs over time in this recession:
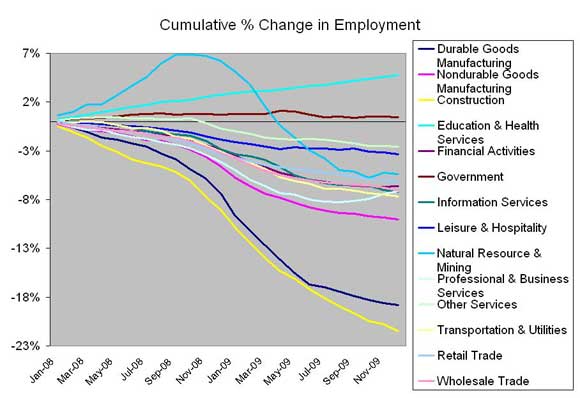
Interestingly, the natural resource and mining sector continues to grow through the first quarter of 2009. After that, however, every industry sector other than education and health care either outright declines in employment growth or, in the case of government, slows down. I may be reading too much in the figure, but what I see is that the recession starts off as an Arnold Kling recalculation event but by mid-2009 turned into a Scott Sumner aggregate demand collapse.
Disclaimer: This page contains affiliate links. If you choose to make a purchase after clicking a link, we may receive a commission at no additional cost to you. Thank you for your support!


Leave a Reply