Why were the aughts so nasty for stocks?
The U.S. ended the decade more or less where it began in terms of total employment.
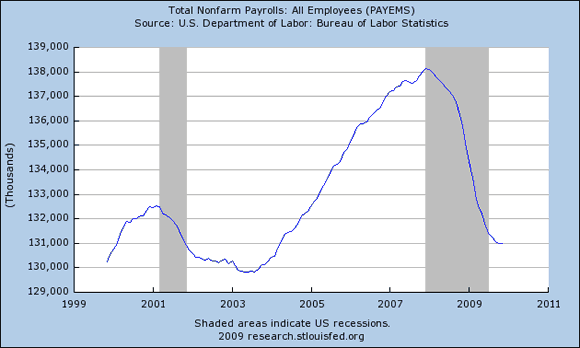
Source: FRED
The owners of capital fared no better, with the nominal S&P500 stock price index down 20% for the decade. The dividends stockholders collected made up for some of that, but inflation took away even more.
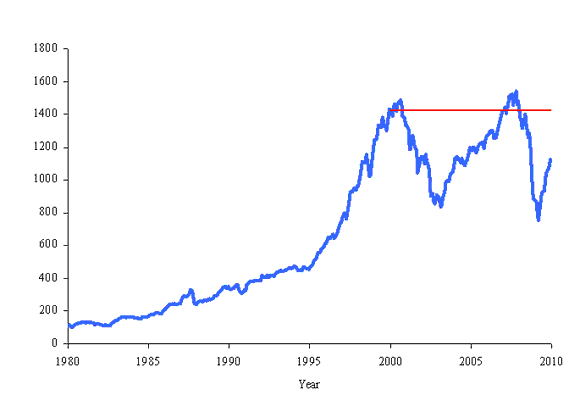
Blue line: Nominal value of S&P500 stock index, January 1980 to December 2009. Red line: value as of January 2000. Data source: Robert Shiller.
One of the reasons stocks did so badly was that real earnings ended the decade 80% lower than they began. Even when you smooth out cyclical variations by taking a decade-long average as in the dashed blue line below, the downturn in earnings at the end of the decade is still pretty significant.
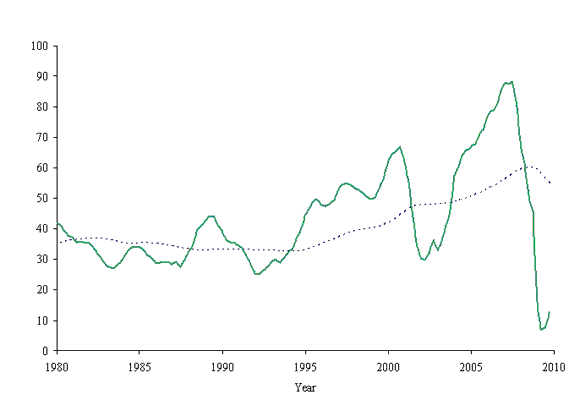
Green line: Real value (in 2009 dollars) of earnings on the S&P500, January 1980 to December 2009. Dashed blue line: arithmetic average of green line for the preceding 10 years. Data source: Robert Shiller.
But a bigger reason why stocks did so badly was the changed valuation of those earnings. Yale Professor Robert Shiller likes to summarize this by using decade-long averages of real earnings to calculate a price-earnings ratio. In January 2000, this cyclically adjusted P/E ratio was profoundly out of line with the average values we’d seen over the previous century. If you trust the tendency of this series to revert to its long-run average, it means that whenever the blue line is above the red, you should expect stock prices to grow at a slower rate than earnings. If you bought when the blue was as far above the red as it was in January 2000, then I hope there was something else you found to enjoy about the naughty aughts.
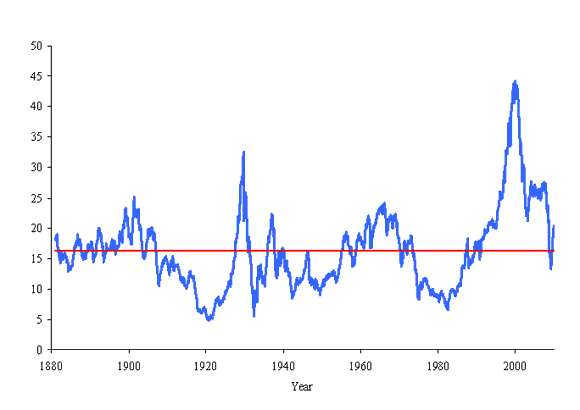
Cyclically adjusted P/E over the last century. Blue line: Ratio of real value (in 2009 dollars) of S&P composite index to the arithmetic average value of real earnings over the previous decade, January 1880 to December 2009. Red line: historical average (16.34). Data source: Robert Shiller.
That doesn’t mean you should never buy when the P/E exceeds its historical average. If you buy at those times, you may expect to earn a return below the average historical real yield of 5.5% per year, but it could be that this lower return of, say, 4% would still be better than you can get anywhere else, and good enough for your saving objectives. In 1995, Shiller’s long-run P/E was a bit rich by historical standards at about 20, right where it is today. If you bought at those high prices in 1995 and sold at the even higher prices in 2000, then you did very, very well. But if you’re smart enough to know exactly how to pull that off, then I’m smart enough to know that I’m not you.
Shiller’s graph persuaded me to keep extra cash entirely out of stocks for most of the last 15 years. I shared with Econbrowser readers my reasons for going back into the market over November 2008 through the spring of 2009. In retrospect, that was the one brief window over the last 20 years when Shiller’s calculation suggests you could earn above-average historical returns from buying stocks.
Many financial analysts used to give the advice to put steady monthly amounts into stocks and hold for the long term, trusting in the long-run averages eventually to give you that 5.5% annual real return. The experience of the last decade has spooked some people out of that philosophy. I think it still makes sense provided that the long-run P/E doesn’t get above 20; beyond that, you want to be aware of the risks.
Some people have the psychological reaction that when stock prices have been going down, equities are becoming a riskier investment. I take the opposite view– the higher stock prices go, the scarier they look to me.
Disclaimer: This page contains affiliate links. If you choose to make a purchase after clicking a link, we may receive a commission at no additional cost to you. Thank you for your support!

Leave a Reply