Last April I described new research on the role of oil prices in the recent recession. Here’s an update on what’s happened since then.
In a paper presented at the Brookings Institution last spring, I examined the post-sample forecasting performance of an equation originally published in 2003, which relates real GDP to past values of GDP and oil prices. I noted in April that if you had known in October 2007 the values of GDP through 2007:Q3 and what was about to happen to oil prices through 2008:Q2, you could have used that historical relation to predict the value of U.S. real GDP for 2008:Q3 with an accuracy better than 99.5%.
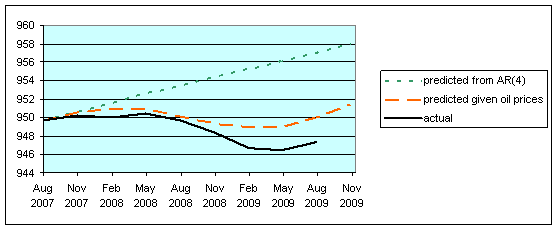
Solid line: 100 times the natural log of real GDP. Dotted line: dynamic forecast (1- to 9-quarters ahead) based on coefficients of univariate AR(4) estimated 1949:Q2 to 2001:Q3 and applied to GDP data through 2007:Q3. Dashed line: dynamic conditional forecast (1- to 9-quarters ahead) based on coefficients reported in equation (3.8) in Hamilton (2003) (which was estimated over 1949:Q2 to 2001:Q3) applied to GDP data through 2007:Q3 and conditioning on the ex-post realizations of the net oil price increase measure.
In the figure above I extend the earlier-reported forecast an additional four quarters and compare the projection with what actually happened to GDP through 2009:Q3. The dotted green line is a forecast formed in October 2007 of what would happen to U.S. GDP if you used nothing more than the values of GDP observed through 2007:Q3. Basically that forecast simply extrapolates the recent prior trend. The dashed red line is the forecast that uses GDP values only through 2007:Q3 but also uses knowledge of what was going to happen to oil prices between 2007:Q4 and 2009:Q3. If you treated oil prices as the only thing that matters for the economy, you would have predicted the bottom would be reached in 2009:Q1, flat growth between 2009:Q1 and 2009:Q2, and normal growth resuming in 2009:Q3. That’s exactly the trajectory that GDP has taken so far, although the bottom in 2009:Q2 was 2-1/2 percent lower than would be predicted on the basis of oil prices alone.
I have no doubt that the problems with financial markets were a bigger factor than oil prices in the striking collapse in output in 2008:Q4 and 2009:Q1. The other approaches to measuring the contribution of oil to the downturn surveyed in my Brookings paper would estimate a smaller contribution of oil to the downturn than suggested by the figure above. On the other hand, all of the approaches surveyed in that paper suggest that oil made a material contribution to the initial downturn, and it seems hard to deny that that the severity of the financial crisis was exacerbated by the fact that the U.S. had spent three quarters in recession prior to the failure of Lehman in September 2008.
What do these estimates imply looking forward, with oil prices now back up to $80 a barrel? The relation used to produce the figure above assumes that there is a threshold effect before the next oil price shock would begin to do its damage. According to that relation, oil has to get back above $130 before it would matter again for GDP growth. On the other hand, the original research on which that relation is based acknowledged that there’s really not a very compelling basis in the data for choosing among various plausible nonlinear possibilities. The other approaches surveyed in my Brookings study assume a simple linear relation, according to which the recent resurgence in oil prices would already begin to exert a drag on spending.
Another magnitude that I think is important to watch is the share of the budget of an average U.S. consumer that is devoted to energy purchases. This had fallen considerably in the 1990s, making it easier for many consumers to largely ignore modest energy price fluctuations. When this share rises above 6%, it seems to become a more significant factor. The consumer energy expenditure share peaked last summer at 6.8%, but collapsing energy prices subsequently brought it back down to 4.7%. The resurgence in oil prices this summer had pushed that share back up to 5.4% in September.
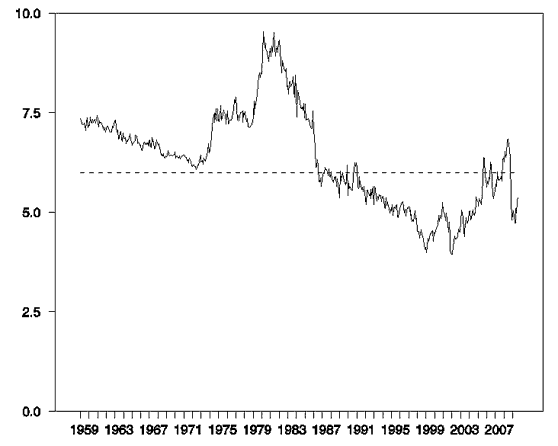
Energy expenditures as a fraction of consumer spending. Calculated as 100 times nominal monthly consumption expenditures on energy goods and services divided by total personal consumption expenditures. Data source: BEA Table 2.3.5U, “Personal Consumption Expenditures by Major Type of Product and Expenditure,” obtained from Econstats. Dashed line is drawn at 6.0%.
And the price of oil is up another 15% since September.
Will rising oil prices derail the recovery?
Disclaimer: This page contains affiliate links. If you choose to make a purchase after clicking a link, we may receive a commission at no additional cost to you. Thank you for your support!

Leave a Reply