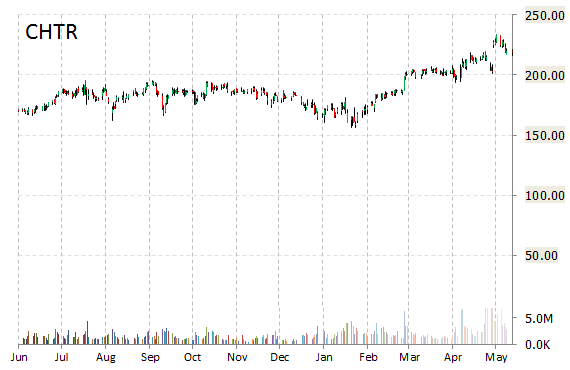
Analysts at Raymond James are out with a report this morning upgrading shares of Charter Communications, Inc. (CHTR) with a ‘Strong Buy’ from ‘Outperform’ rating.
In the past 52 weeks, shares of Stamford, Connecticut-based company have traded between a low of $156.13 and a high of $233.70 and are now at $225.07. Shares are up 22.21% year-over-year and 19.57% year-to-date.
CHTR shares are up $6.57, or over 3.00%, at $225.51.
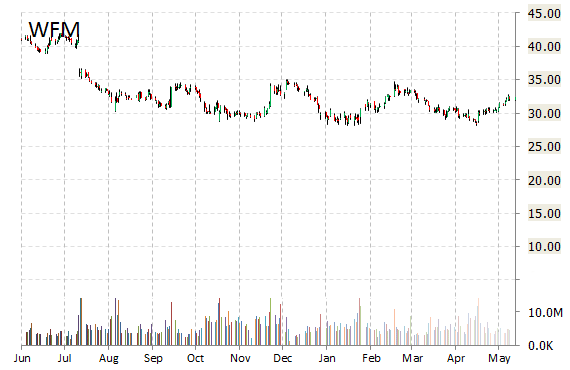
Analysts at Credit Suisse upgraded their rating on the shares of Whole Foods Market, Inc. (WFM). In a research note published on Wednesday, the firm lifted the name with a ‘Outperform’ from ‘Neutral’ rating.
On valuation measures, Whole Foods Market shares are currently priced at 23.12x this year’s forecasted earnings compared to the industry’s 22.92x earnings multiple. Ticker has a PEG and forward P/E ratio of 3.69 and 21.49, respectively. Price/Sales for the same period is 0.67 while EPS is $1.47. Currently there are 3 analysts that rate WFM a ‘Buy’, 20 rate it a ‘Hold’. 3 analyst rates it a ‘Sell’. WFM has a median Wall Street price target of $30.00 with a high target of $38.00.
WFM shares are higher by nearly 4.84% to $33.92 in mid-day trading.
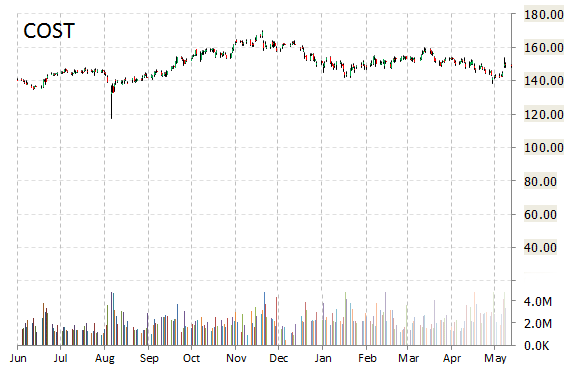
Costco Wholesale Corporation (COST) was raised to ‘Buy’ from ‘Neutral’ and it was given a $175 from $169 price target at Goldman on Wednesday.
Midway through trading Wednesday, 2.04 million shares of Costco have exchanged hands as compared to its average daily volume of 2.89 million shares. The stock ranged in a price between $150.32-$153.00 after having opened the day at $150.50 as compared to the previous trading day’s close of $148.77.
COST shares surged 2.42% to $152.37 in mid-day trading.
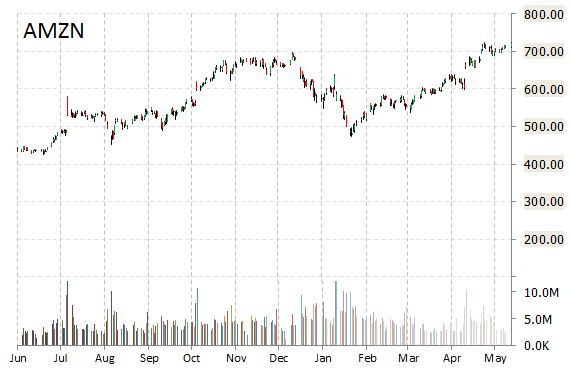
Amazon.com, Inc. (AMZN) rating of ‘Buy’ was reiterated today at MKM Partners with a price target increase of $850 from $800 (versus a $722.79 previous close).
In the past 52 weeks, shares of the online retailer have traded between a low of $419.14 and a high of $726.40 with the 50-day MA and 200-day MA located at $667.73 and $618.73 levels, respectively. Additionally, shares of AMZN trade at a P/E ratio of 2.42 and have a Relative Strength Index (RSI) and MACD indicator of 69.84 and +11.77, respectively.
AMZN shares climbed 0.06% to $723.19 in mid-day trading.


Leave a Reply