In the wake of some recent economic reports, most prominently the employment report, there’s some discussion of how the recovery is in doubt [1], possibly leading to a “W”, or double dip, [2]. Anxieties focus on 2010 or possibly 2011. I think, in retrospect, such worries cast the criticisms of the stimulus bill in a different light than just a few months ago.
First, to the current situation and outlook:
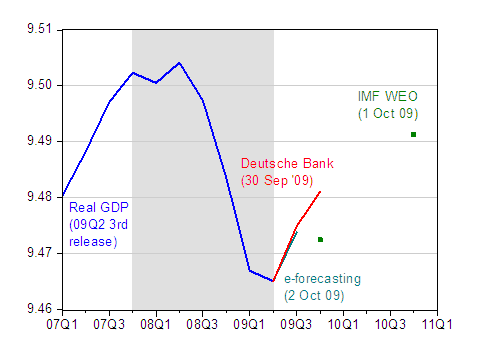
Figure 1: Log GDP, SAAR, in Ch.2005$ (blue), Deutsche Bank forecast of 9/30 (red), e-forecasting estimate of 10/2 (teal), and IMF World Economic Outlook forecast of 10/1 (green squares). NBER defined recession shaded gray, assumes trough at 2009Q2. Sources: BEA, GDP 3rd release of 2009Q2, Deutsche Bank Global Economic Perspectives, e-forecasting, IMF, World Economic Outlook, NBER, and author’s calculations.
Note that the newly released IMF WEO forecasts project continued growth into 2010. Of course, that’s just a forecast. In fact, preliminary real time estimates of 09Q3 GDP suggest a somewhat faster rebound in activity than the IMF anticipates.
But if indeed there is underlying weakness in 2010 or 2011, then it’s a good thing the stimulus package incorporated substantial spending for long-gestating infrastructure projects. Indeed, I made this exact point (on repeated occasions [3] [4] [5]) — that with the recession likely being of a prolonged nature, and the recovery relatively slow, these concerns were misplaced. Nonethelss, I suspect that those many critics of the stimulus package will not be retracting their criticisms in 2010.
Just to remind readers, depicted below is the projected spend-out time profile as estimated by CBO back in February, and graphed in this February 16th post.
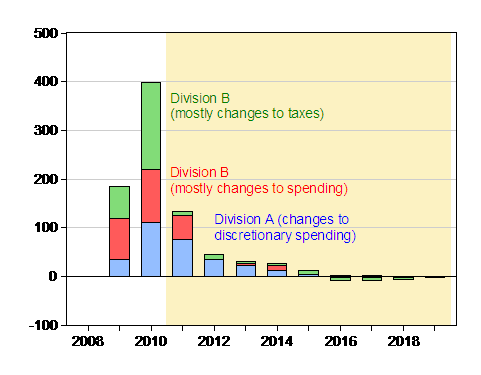
Figure 2: Estimated spending and tax revenue reductions, per fiscal year, embodied in HR 1 final version. Shaded areas pertain to spending occurring outside of the 19.5 month time frame. Source: CBO, H.R. 1, American Recovery and Reinvestment Act of 2009 (February 13, 2009).
Mark Zandi’s June 2009 quarter-by-quarter spend-out estimates are here:
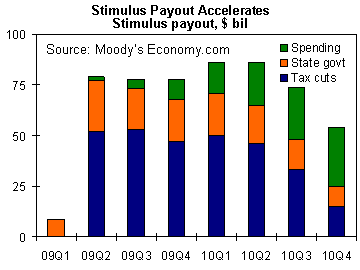
Figure 3: from M. Zandi, “US Fiscal Stimulus Revisited,” Economy.com (June 22, 2009).
As it turns out, Zandi’s estimates for 2009Q2 were a bit low, but not too far off of the $99.8 billion cited by the CEA [6].
As the stimulus spending diminishes, the impact on 2010Q4 growth becomes negative, according to Zandi’s estimates. However, it’s important to recall that this is an impact on the first derivative. The level of output will still be above what it would be in the no-stimulus counterfactual — in other words the output gap would be smaller than otherwise.
“W” and the Stimulus Package in Perspective
Disclaimer: This page contains affiliate links. If you choose to make a purchase after clicking a link, we may receive a commission at no additional cost to you. Thank you for your support!

Leave a Reply