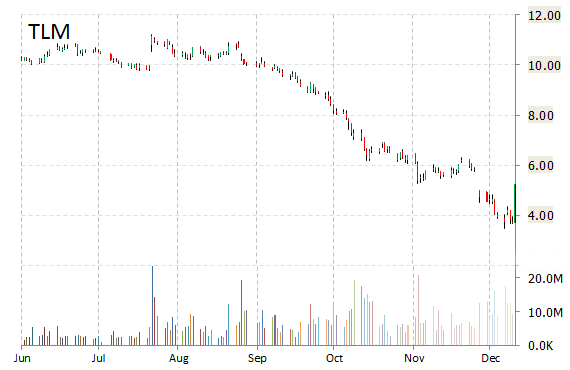
Shares of Talisman Energy Inc. (TLM) are higher by 35% on heavy volume in midday trading on Friday, after an FT report stated that Spain’s Repsol SA may be near a deal to acquire TLM for up to $8 per share, or a 117% premium. Such a the deal would give Talisman an enterprise value of about $10B-$12B, including debt, the report added.
Talisman Energy Inc. gained $1.27 to $4.99 in mid-day trading today. Approximately 47M shares have already changed hands, well above the average of 8.62 million for a full session over the past 3 months.
On valuation-measures, shares of Talisman Energy have a forward P/E of 249.50. P/E to growth ratio is 7.19, while t-12 profit margin is (6.54%). EPS registers at ($0.41). The company has a market cap of $5.12B and a median Wall Street price target of $6.99 with a high target of $13.00.
On trading-measure, TLM has a beta of 1.39 and a short float of 1.23%. In the past 52 weeks, shares of Calgary, Canada-based oil and gas company have traded between a low of $3.46 and a high of $11.86 with the 50-day MA and 200-day MA located at $5.45 and $8.66 levels, respectively.
TLM currently prints a one year loss of about 66.82% and a year-to-date loss of around 67.08%.
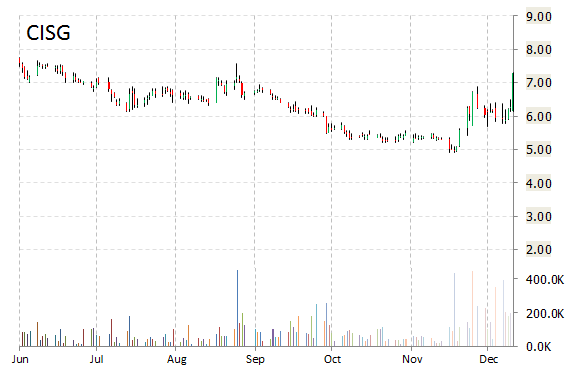
CNinsure Inc. (CISG) shares are up 11.50% to $6.98 in mid-day trading. The move comes on a big volume too with the issue currently trading more than 560K shares, compared to the average volume of 112,180. Not seeing any news or rumors to account for the move.
CNinsure Inc. is a Guangzhou, China-based distributor of insurance products. Its stock has a median consensus analyst price target of $9.00 and a 52-week trading range of $4.90 to $9.22. The T-12 profit margin at CNinsure is 7.90%. CISG‘s revenue for the same period is $326.73 million.
CNinsure Inc. has market cap of $352.70 million.
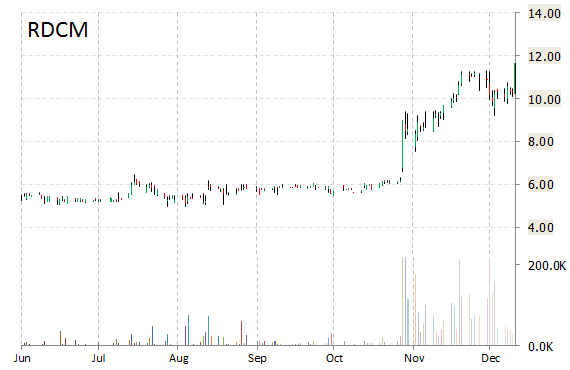
Radcom Ltd‘s (RDCM) price target has been raised to $13.50 from $7.50 by H.C. Wainwright analysts, according to a research note published on Friday. The firm’s analysts maintained their ‘Buy’ rating on the name saying that Radcom’s new $4.3 million purchase order for MaverIQ announced on Nov. 20, prompted H.C. Wainwright’s confidence in the firm’s ability to deliver stronger gross margins, and thus earnings in fiscal 2015. The new price target represents a potential upside of 18% from ticker’s current pps.
Radcom Ltd. gained $0.82, or 8%, to $11.13 in mid-day trading today. Approximately 145K shares have already changed hands, compared to the stock’s average daily volume of 72.22K.
On valuation-measures, shares of Radcom Ltd. have a trailing-12 and forward P/E ratio of 73.71 and 24.58, respectively. T-12 profit margin is 5.46%, while EPS registers at $0.15. The company has a market cap of $89.85M and a median Wall Street price target of $7.50.
On trading-measure, RDCM has a beta of 3.32 and a short float of 2.06%. In the past 12 months, shares of Tel-Aviv, Israel-based customer experience solutions provider have traded between a low of $4.61 and a high of $11.65.
RDCM currently prints a one year return of about 112.58% and a year-to-date return of around 94.53%.
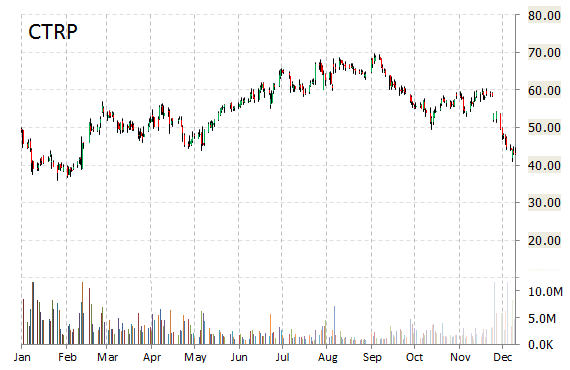
Shares of Shanghai-based Ctrip.com International Ltd. (CTRP) are up almost 7% to $45.96 in midday trading Friday, following a positive mention at Chinese firm 86 Research suggesting insiders are accumulating shares.
Ctrip.com International shares are currently priced at 61.21x this year’s forecasted earnings compared to the industry’s 15.31x earnings multiple. Ticker has a PEG and forward P/E ratio of 11.25 and 110.05, respectively. Price/Sales for the same period is 5.29 while EPS is $0.75. Currently there are 10 analysts that rate CTRP a ‘Buy’, 10 rate it a ‘Hold’. 1 analyst rates it a ‘Sell’. CTRP has a median Wall Street price target of $60.00 with a high target of $72.00.
In the past 52 weeks, shares of Ctrip have traded between a low of $35.96 and a high of $69.74, which is almost 94% above that low price. Ticker is down 8.14% year-over-year and 13.30% year-to-date.
The chart below shows where the stock has traded over the last 12 months.
Disclaimer: This page contains affiliate links. If you choose to make a purchase after clicking a link, we may receive a commission at no additional cost to you. Thank you for your support!
Leave a Reply