Recent short interest data for the 8/29/2014 settlement date shows an increase in short interest for shares of Valero Energy Corporation (VLO). As of August 29, the short interest for the independent petroleum refining and marketing company totaled 10,329,294 shares, as compared to 9,980,835 shares since August 15, an increase of 3.49%. Average daily volume [AVM] for the same period fell by 1.25M to 4,443,499 shares from 5,702,708 shares. It is worth mentioning that ticker’s short interest has declined by more than 3M shares, or 23.92%, from the 6/13/2014 settlement date.
Based on the latest AVM, the days-to-cover ratio — a metric that includes both the total shares short and the average daily volume of shares traded — is currently 2.32 days. Days-to-cover for VLO increased to 2.32 for the August 29 settlement date, as compared to 1.75 days at the August 15 report.
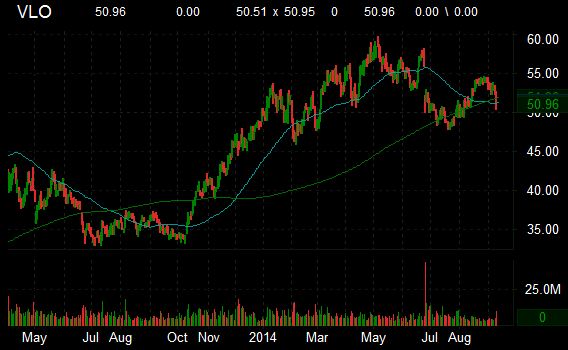
Valero Energy Corporation has a beta of 2.48 and a short float of 1.97%. In the past 52 weeks, shares of the San Antonio, Texas-based company have traded between a low of $33.20 and a high of $59.69 and are now at $50.96. Shares are up 38.63% year-over-year and 1.11% year-to-date.
The chart below shows where the equity has traded over the last year, with the 50-day and 200-day moving averages included.
Recent short interest data for the 8/29/2014 settlement date shows a decrease in short interest for shares of Tesoro Corporation (TSO). As of August 29, the short interest for the refiner and marketer of petroleum products totaled 7,178,383 shares, as compared to 8,015,163 shares since August 15, a decline of -10.44%. Average daily volume [AVM] for the same period fell by 641,000 to 2,060,624 shares from 2,701,208 shares. It is worth mentioning that ticker’s short interest has jumped by more than 1.97M shares, or 38.06%, from the 4/15/2014 settlement date.
Based on the latest AVM, the days-to-cover ratio — a metric that includes both the total shares short and the average daily volume of shares traded — is currently 3.48 days. Days-to-cover for TSO increased to 3.48 for the August 29 settlement date, as compared to 2.96 days at the August 15 report.
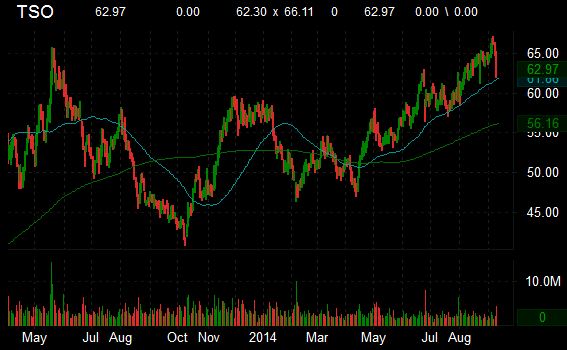
Tesoro Corporation has a beta of 2.32 and a short float of 5.99%. In the past 52 weeks, shares of the San Antonio, Texas-based company have traded between a low of $40.90 and a high of $67.07 and are now at $62.97. Shares are up 34.61% year-over-year and 7.64% year-to-date.
The chart below shows where the equity has traded over the last year, with the 50-day and 200-day moving averages included.
Recent short interest data for the 8/29/2014 settlement date shows an increase in short interest for shares of Equity Residential (EQR). As of August 29, REIT’s short interest totaled 8,801,383 shares, as compared to 8,382,763 shares since August 15, an increase of 4.99%. Average daily volume [AVM] for the same period fell by 382,000 to 1,139,753 shares from 1,521,979 shares. It is worth mentioning that ticker’s short interest has declined by more than 1.43M shares, or 14%, from the 5/15/2014 settlement date.
Based on the latest AVM, the days-to-cover ratio — a metric that includes both the total shares short and the average daily volume of shares traded — is currently 7.72 days. Days-to-cover for EQR increased to 7.72 for the August 29 settlement date, as compared to 5.50 days at the August 15 report.
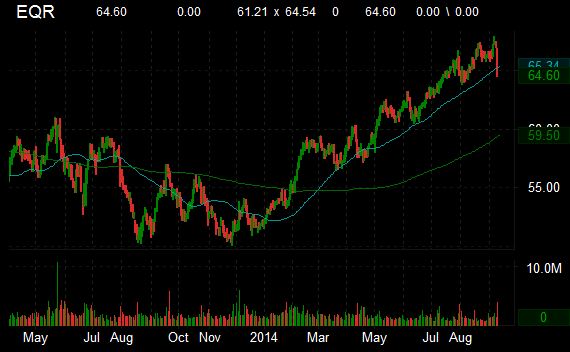
Equity Residential has a beta of 0.64 and a short float of 2.49%. In the past 52 weeks, shares of the Chicago, Illinois-based investment fund have traded between a low of $50.08 and a high of $67.91 and are now at $64.60. Shares are up 21.79% year-over-year and 24.54% year-to-date.
The chart below shows where the equity has traded over the last year, with the 50-day and 200-day moving averages included.
Recent short interest data for the 8/29/2014 settlement date shows a decrease in short interest for shares of Visa Inc. (V). As of August 29, the short interest for the payments technology firm totaled 16,358,699 shares, as compared to 17,059,935 shares since August 15, a decline of -4.11 %. Average daily volume [AVM] for the same period fell by 164,000 to 2,056,763 shares from 2,222,593 shares. It is worth noting that ticker’s short interest has jumped by more than 2.5M shares, or 18.10%, from the 4/15/2014 settlement date.
Based on the latest AVM, the days-to-cover ratio — a metric that includes both the total shares short and the average daily volume of shares traded — is currently 7.95 days. Days-to-cover for V increased to 7.95 for the August 29 settlement date, as compared to 7.67 days at the August 15 report.
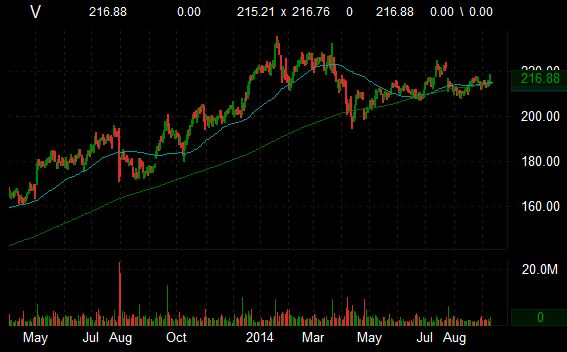
Visa Inc. has a beta of 0.64 and a short float of 3.29%. In the past 52 weeks, shares of the San Francisco, California-based company have traded between a low of $180.11 and a high of $235.50 and are now at $216.88. Shares are up 22.76% year-over-year ; down 2.6 % year-to-date.
The chart below shows where the equity has traded over the last year, with the 50-day and 200-day moving averages included.
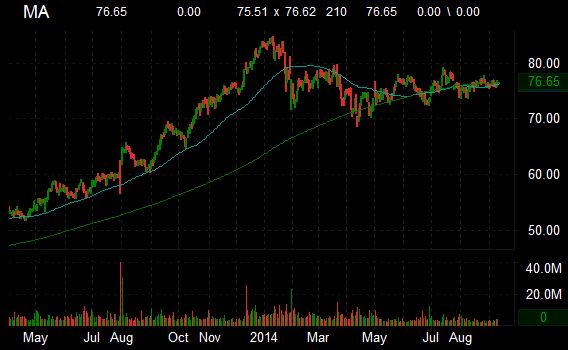
Recent short interest data for the 8/29/2014 settlement date shows a decrease in short interest for shares of MasterCard Incorporated (MA). As of August 29, the short interest for the transaction processing and other payment-related services firm totaled 12,178,904 shares, as compared to 13,007,969 shares since August 15, a decline of -6.37 %. Average daily volume [AVM] for the same period fell by about 839,000 to 3,084,913 shares from 3,923,403 shares.
Based on the latest AVM, the days-to-cover ratio — a metric that includes both the total shares short and the average daily volume of shares traded — is currently 3.94 days. Days-to-cover for MA increased to 3.94 for the August 29 settlement date, as compared to 3.31 days at the August 15 report.
MasterCard Inc. has a beta of 0.77 and a short float of 1.40%. In the past 52 weeks, shares of the Purchase, New York-based company have traded between a low of $64.74 and a high of $84.75 and are now at $76.65. Shares are up 20.41% year-over-year ; down 8.26% year-to-date.
The chart below shows where the equity has traded over the last year, with the 50-day and 200-day moving averages included.
Disclaimer: This page contains affiliate links. If you choose to make a purchase after clicking a link, we may receive a commission at no additional cost to you. Thank you for your support!
Leave a Reply