The performance chart obtained from the WSJ shows how different global financial markets performed during the past week.
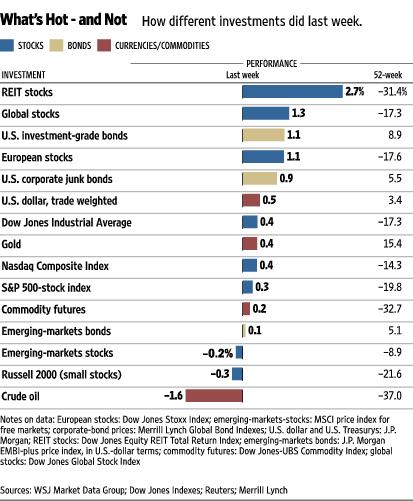
As the chart above illustrates, REIT’s dominated the performance spectrum convincingly. The asset class gained 2.7% in the week, followed by Global stocks, US investment grade bonds, and Euro stocks, 1.3%, 1.1%, 1.1%, respectively. Excluding EMs, R2K, and crude oil, the rest of investments posted gains (granted modest ones) across the board. On a y/y basis however, the majority of them still remain in the red.
Disclaimer: This page contains affiliate links. If you choose to make a purchase after clicking a link, we may receive a commission at no additional cost to you. Thank you for your support!
Leave a Reply