In my previous post I reviewed the recent experience of a number of countries whose sovereign debt levels became sufficiently high that creditors began to have doubts about the government’s ability to stabilize debt relative to GDP. When this happens, the government starts to face a higher interest rate, which makes debt stabilization all the more difficult. Is there any danger of the same adverse feedback loop starting to matter for the United States?
Let me begin with some basic definitions. The deficit is the difference between what the government spends and what it collects in revenues during a given year. It is what economists describe as a flow variable, measured in dollars per year. By contrast, the debt refers to a stock variable: the total sum that the government owes at any point in time. The relation between these two measures is that the deficit during a given year is equal to the change in the debt between this year and next. If the government spends more than it takes in as revenue (that is, if it runs a deficit), it’s going to have to roll over its existing debt as well as issue new debt to cover the current year’s shortfall (that is, it’s going to have to increase the debt). Thus even though the deficit may be falling from one year to the next, as long as the deficit is positive, the level of debt will be growing from one year to the next.
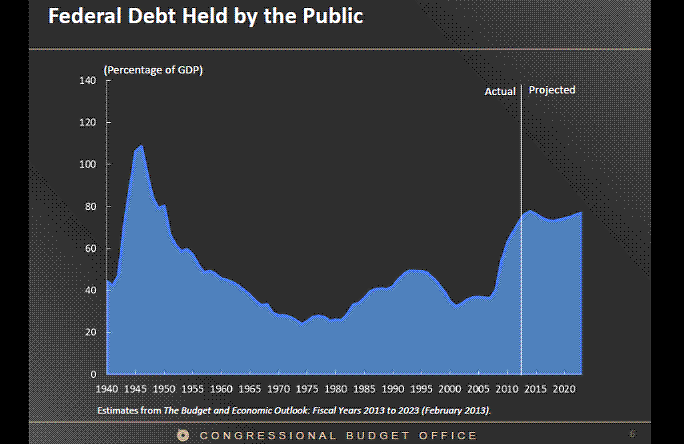
The Congressional Budget Office reports that gross federal debt as of the end of 2012 stood at just over $16 trillion, or 102% of GDP. However, much of this is owed to other government accounts such as the Social Security Trust Fund. Many economists prefer to subtract out the sums that the government “owes” to itself to arrive at a net debt figure, sometimes referred to as debt held by the public. As of the end of 2012, federal debt held by the public was $11.3 T, or 72% of GDP.
(click to enlarge)
Figure 1. Source: Elmendorf (2013).
The tipping-point dynamics come from the burden of meeting the interest payments on the debt. For any given interest rate, the higher the stock of debt that the government owes, the higher the expenditure flow each year will be required just to make interest payments on the government debt. For 2012, federal net interest payments came to $223 B. That corresponds to 1.4% of GDP, or about one-third the size of the 2012 defense budget. The reason that the interest burden is so low despite a historically high debt load is because interest rates on government debt are lower at the moment than they have been any time over the last half century.
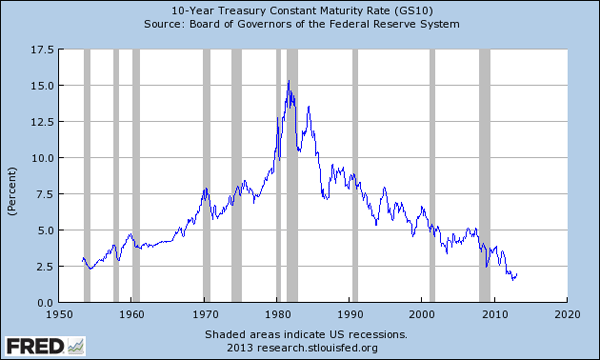
Figure 2. Source: FRED.
But is it reasonable to anticipate that long rates will continue to remain at these unusually low levels? The figure below shows forecasts of the interest rate on 10-year U.S. Treasury bonds over the next 4 years arrived at using several different methods. The purple line is a statistical inference based on the current values of interest rates on different Treasury securities and a structural interest-rate model of what the current levels of these rates imply for a rational forecast of their future values. The blue and black lines are consensus estimates from the Survey of Professional Forecasters and the Blue Chip survey, while the green is the CBO’s projections. All four estimates suggest rates could rise considerably within the next few years.

(click to enlarge)
Figure 3. Source: Bernanke (2013).
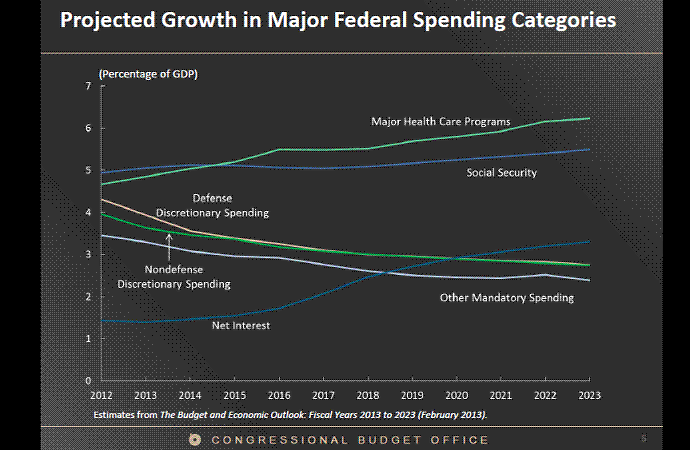
Recall that the debt itself will be growing as a result of continuing deficits. A higher interest rate and growing level of debt would mean that the fraction of federal spending that is taken up by interest expenses will grow considerably over the next decade. The CBO anticipates that, under current law (that is, assuming for example that the recent “sequester” and planned future spending reductions remain in effect), federal net interest expense will grow to 3.3% of GDP by 2023. At that point (and again assuming that the spending reductions specificed under current law continue for the decade), interest expense would be higher than either the total defense budget or the total discretionary component of the nondefense budget.
(click to enlarge)
Figure 4. Source: Elmendorf (2013).
Figure 4 above assumes that defense and other discretionary spending fall as a percent of GDP over the next decade. If this does not happen, then without changes in the other components of the budget or the projected path of GDP, the run-up in debt would be larger than assumed in Figure 1 above and interest expense would be greater than 3.3% of GDP.
The CBO has not yet updated their projection of what current law would imply for debt and interest expense beyond 2023. In a recent paper with David Greenlaw at Morgan Stanley, Peter Hooper at Deutsche Bank, and Frederic Mishkin at Columbia, we made a guess at the sort of numbers CBO might come up with for those longer-term projections when they update their long term assessment from last year. We calculate that net interest expense under those assumptions is likely to continue to grow as a percent of GDP.
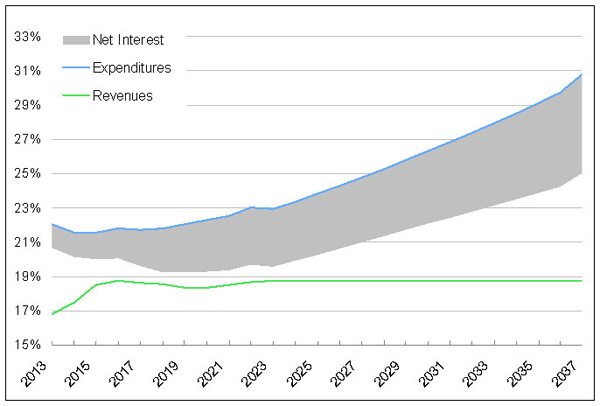
Figure 5. Projected federal revenue and expenses as a percent of GDP using similar methodology to CBO (2012), as calculated by Greenlaw, Hamilton, Hooper, and Mishkin (2013).
In arriving at the above projections, we made the same kind of assumption about interest rates as CBO in both their “Extended Baseline Scenario” and “Extended Alternative Scenario” in Figure 1 of the long-term outlook that CBO issued in 2012, namely, that the nominal interest rate eventually rises to 5.2% and then stays there indefinitely.
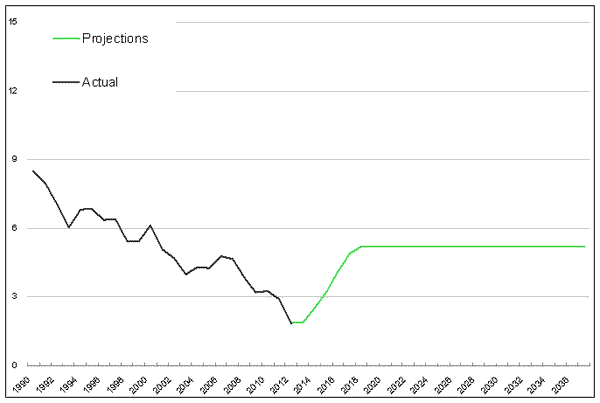
Figure 6. Historical and projected 10-year yield assumed in the calculations behind Figure 5. Source: Greenlaw, Hamilton, Hooper, and Mishkin (2013).
However, under this same scenario, debt continues to grow as a percentage of GDP.
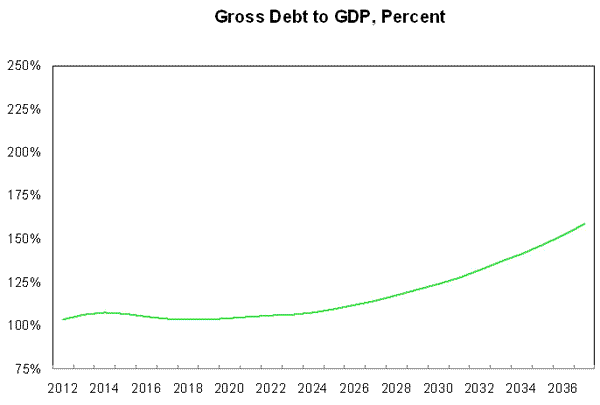
Figure 7. Gross debt as a percent of GDP assumed in the calculations behind Figure 5. Source: Greenlaw, Hamilton, Hooper, and Mishkin (2013).
The question we raise is whether it would be reasonable to make such an assumption under the scenario just described. The supply of Treasury debt is projected to continue to grow as a percent of GDP. Why would the demand for Treasury debt grow faster than GDP if there is no increase in yield?
CBO’s 2012 long-term assessment also considered the possibility that increasing debt-to-GDP levels would result in rising yields. Such a possibility is presented in their Figure 2-1 where it is described as an “extended alternative fiscal scenario with effects”. These effects arise from a gradual crowding-out of private investment that is part of their long-term growth model. However, in my paper with Greenlaw, Hooper, and Mishkin we call attention to another channel that could be far more significant. As would-be buyers of Treasury debt observe that the fiscal path is unsustainable, they might rationally perceive that the only way to return to a sustainable path would be through unanticipated inflation or outright default. But such perceptions would result in the government needing to offer a higher interest rate as compensation for this risk. Below is our simulation of how the debt load would evolve under the same assumptions just used, except allowing the interest rate to rise with the debt levels as predicted on the basis of recent experience in other advanced economies.
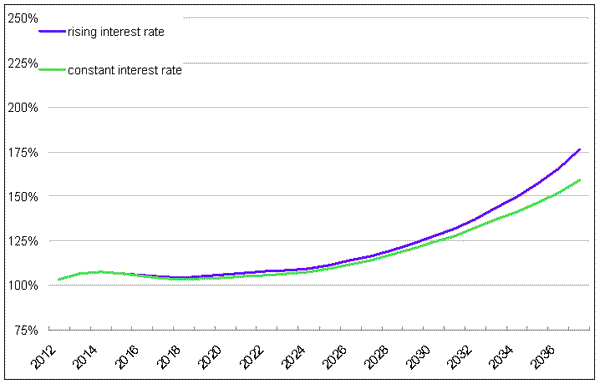
Figure 8. Gross debt as a percent of GDP assuming interest rate never rises above 5.2% (green line) and allowing debt levels to feed back into interest rate (blue) Source: Greenlaw, Hamilton, Hooper, and Mishkin (2013).
The blue path above is conservative in several other respects, assuming for example that unemployment eventually returns to 5-1/4% and that Congress keeps the sequester provisions in place. Using instead a 6% unemployment rate and no sequester, our simulated path looks as follows.
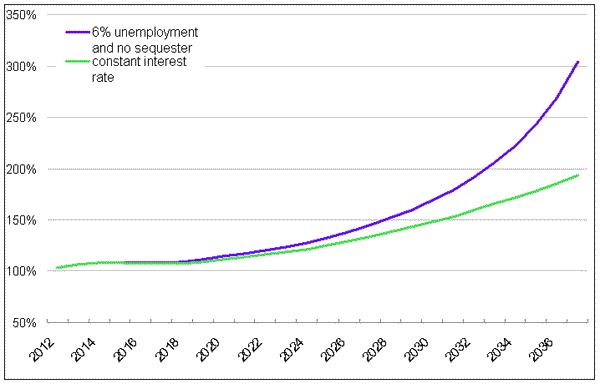
Figure 9. Gross debt as a percent of GDP assuming interest rate never rises above 5.2%, unemployment eventually returns to 5-1/4%, and sequester provisions remain in effect (green line) and allowing debt levels to feed back into interest rate with 6% unemployment and no sequester (blue) Source: Greenlaw, Hamilton, Hooper, and Mishkin (2013).
It is important to recognize that we are not proposing that creditors will all of a sudden refuse to hold dollar-denominated assets. The question instead is whether demand for U.S. Treasury debt will continue to increase every year faster than the U.S. economy can grow.
It is also important to emphasize that we are not claiming that the blue path above is an accurate prediction of what is going to happen, and we certainly hope that it does not. As we wrote in the Wall Street Journal on Friday,
The grave scenarios we outline here do not have to happen. Since the debt-to-GDP ratio is likely to stabilize over the next few years, there is time to avoid the dire potential problems we have highlighted. But with the gross-debt-to-GDP ratio already well above the 80% threshold– and likely to resume a steady climb by the end of this decade– the clock is ticking.
With sufficient political will, the U.S. government can avoid fiscal dominance and achieve long-run budget sustainability by gradually reining in spending on entitlement programs such as Medicare, Medicaid and Social Security, while increasing tax revenue by broadening the base.
A number of plans, including those put forth by members of the Simpson-Bowles Commission and the Domenici-Rivlin Task Force, have already shown the way. The political will to put the fiscal house in order has not yet been summoned—but should be the highest priority of this country’s elected officials.


Leave a Reply