We were playing around with the charts on Friday night (‘cuz that’s what nerds do with their Friday nights) and discovered something very interesting about the 2012 stock market. The results are illustrated in the table and chart below.
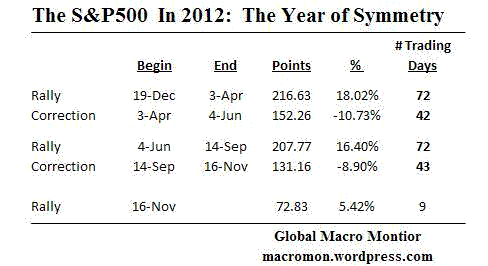
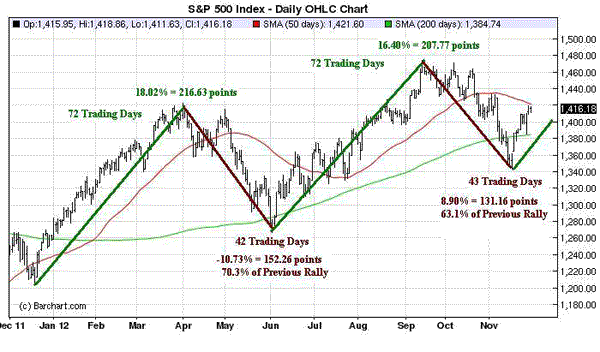
The S&P500 made two major moves to new post crash highs during year. The first was a continuation of the rally that began on December 19th of last year, totaled 216.6 S&P points, or 18.02 percent, and lasted 72 trading days. It was followed by a 152.3 point correction, or 10.73 percent, which lasted 42 trading days.
After bottoming on June 4th, the second rally took the S&P500 to a high of 1,474.51 on September 14th, a move of 207.8 points, or 16.4o percent, which also lasted 72 trading days – the exact same number as the first rally. It doesn’t stop there.
The rally to new highs was followed by a decent sell off of 131.16 points, or 8.90 percent, lasting 43 trading days. Just one more trading day than the April-June correction!
Both corrections ended with nasty bear traps where the S&P500 fell through its 200-day moving average and key .618 Fibonacci retracement levels. The first rally gave up 70.3 percent of its gains during the correction and the second retraced 63.1 percent before reversing.
The the second rally peaked at 125.6 percent of the first rally and 136.4 percent of the retracement, not exactly the 1.272 or 1.382 Fibonacci extensions, but close enough for government work.
Why the symmetry in the 2012 rallies and corrections? We can only speculate it’s a combination of the constant of human emotion and agorithmic trading.
Can we conclude the current 72.8 point rally, which began on November 16th is going to continue a similar total of 72 tradings days and take the S&P500 up 16-18 percent, or another 10-12 percent from? Wish it were that easy, but wouldn’t rule it out, however, especially if Washington can come to a fiscal agreement.
The upshot of this post? Perspective and that technicals and time do matter!


Leave a Reply