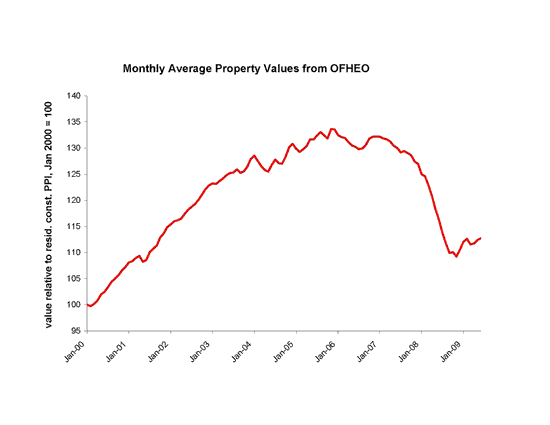
This next chart shows the OFHEO housing price index through June: it showed a turn-around even earlier than Case-Shiller did and continues to confirm that view.
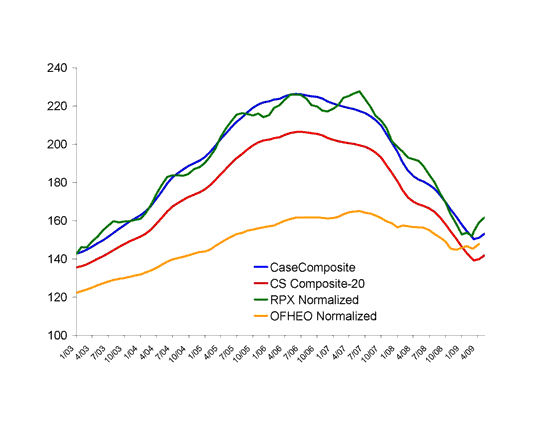
This next chart is from Sean MacLeod (thank you sir! he sent it before the June OFHEO was released), comparing 4 different indices. When I turn back to revising my paper about housing prices and construction, I will learn about the RPX index, but for now all I know is that Sean MacLeod makes a good case that it should be considered.
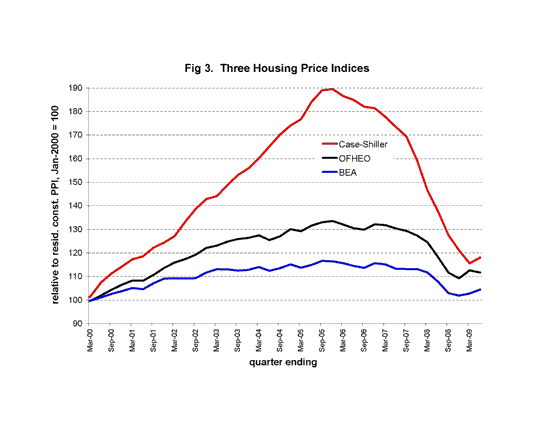
Finally, the BEA has a quarterly index of the price of new “residential structures” (that is, housing!). The chart below shows that index together with quarterly averages of C-S and OFHEO through 2009 Q2.
Disclaimer: This page contains affiliate links. If you choose to make a purchase after clicking a link, we may receive a commission at no additional cost to you. Thank you for your support!
Casey B. Mulligan is a Professor in the Department of Economics. Mulligan first joined the University of Chicago in 1991 as a graduate student, and received his Ph.D. in Economics from the University of Chicago in 1993.
He has also served as a Visiting Professor teaching public economics at Harvard University, Clemson University, and Irving B. Harris Graduate School of Public Policy Studies at the University of Chicago.
Mulligan is author of the 1997 book Parental Priorities and Economic Inequality, which studies economic models of, and statistical evidence on, the intergenerational transmission of economic status. His recent research is concerned with capital and labor taxation, with particular emphasis on tax incidence and positive theories of public policy. His recent work includes Market Responses to the Panic of 2008 (a book-in-process with Chicago graduate student Luke Threinen) and published articles such as “Selection, Investment, and Women’s Relative Wages,” “Deadweight Costs and the Size of Government,” “Do Democracies have Different Public Policies than Nondemocracies?,” “The Extent of the Market and the Supply of Regulation,” “What do Aggregate Consumption Euler Equations Say about the Capital Income Tax Burden?,” and “Public Policies as Specification Errors.” Mulligan has reported on some of these results in the Chicago Tribune, the Chicago Sun-Times, the Wall Street Journal, and the New York Times.
He is affiliated with a number of professional organizations, including the National Bureau of Economic Research, the George J. Stigler Center for the Study of the Economy and the State, and the Population Research Center. He is also the recipient of numerous awards and fellowships, including those from the National Science Foundation, the Alfred P. Sloan Foundation, the Smith- Richardson Foundation, and the John M. Olin Foundation.
We use cookies on our website to give you the most relevant experience by remembering your preferences and repeat visits. By clicking “Accept”, you consent to the use of ALL the cookies.
This website uses cookies to improve your experience while you navigate through the website. Out of these cookies, the cookies that are categorized as necessary are stored on your browser as they are essential for the working of basic functionalities of the website. We also use third-party cookies that help us analyze and understand how you use this website. These cookies will be stored in your browser only with your consent. You also have the option to opt-out of these cookies. But opting out of some of these cookies may have an effect on your browsing experience.
Necessary cookies are absolutely essential for the website to function properly. This category only includes cookies that ensures basic functionalities and security features of the website. These cookies do not store any personal information.
Functional cookies help to perform certain functionalities like sharing the content of the website on social media platforms, collect feedbacks, and other third-party features.
Performance cookies are used to understand and analyze the key performance indexes of the website which helps in delivering a better user experience for the visitors.
Analytical cookies are used to understand how visitors interact with the website. These cookies help provide information on metrics the number of visitors, bounce rate, traffic source, etc.
Advertisement cookies are used to provide visitors with relevant ads and marketing campaigns. These cookies track visitors across websites and collect information to provide customized ads.

Leave a Reply