Daniel Lee and I made these graphs showing the income distribution of voters self-classified by ideology (liberal, moderate, or conservative) and party identification (Democrat, Independent, or Republican). We found some surprising patterns:
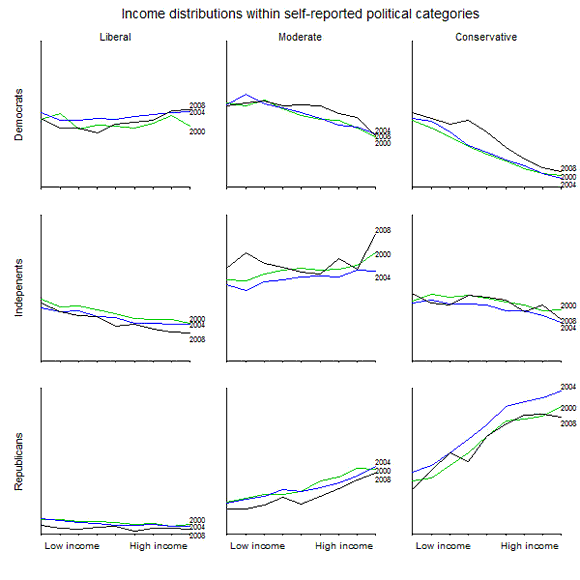
Each line shows the income distribution for the relevant category of respondents, normalized to the income distribution of all voters. Thus, a flat line would represent a group whose income distribution is identical to that of the voters at large. The height of the line represents the size of the group; thus, for example, there were very few liberal Republicans, especially by 2008.
The most striking patterns to me are:
1. The alignment of income with party identification is close to zero among liberals, moderate among moderates, and huge among conservatives. If you’re conservative, then your income predicts your party identification very well.
2. First focus on Democrats. Liberal Democrats are spread among all income groups, but conservative Democrats are concentrated in the lower brackets.
3. Conservative Republicans–the opposite of liberal Democrats, if you will–are twice as concentrated among the rich than among the poor.
Putting factors 2 and 3 together, we find that ideological partisans (liberal Democrats and conservative Republicans) are not opposites in their income distributions. In particular, richer voters are more prevalent in these groups.
Which might be relevant for the debates over health care, taxes, and other political issues that have a redistributive dimension.
P.S. The 2000 and 2004 data are from the National Annenberg Election Survey; 2008 is from the Pew Research pre-election surveys. We show all three years to indicate the persistence of the general pattern. As a way of showing uncertainty and variation, this is much more effective than displaying standard errors, I think.
Disclaimer: This page contains affiliate links. If you choose to make a purchase after clicking a link, we may receive a commission at no additional cost to you. Thank you for your support!

Leave a Reply