After the first few months of President Barack Obama’s term in office, I wrote about the carnival rollercoaster the market was riding. Looking at the blue line below, that post may have foreshadowed his tenure! The average of four-year presidential cycles from 1953 through 2008 shows that the S&P 500 Index generally remains flat for almost the first two years, before heading higher in the second half.
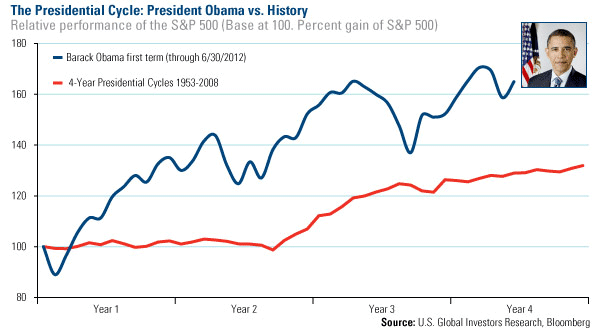
Despite the S&P’s wild ride, the market is significantly higher than when Obama took the oath. Does this ensure a victory for the 2012 election?
To paraphrase common fund disclosure, past performance is not indicative of future presidential performance. Rather, victory for the president depends on what the market does in the next few critical months.
If the S&P remains strong, then the answer might be yes, says Adam Hamilton from Zeal Intelligence. He points to research done by InvesTech, which looked at market results during the two months leading up to the presidential election since 1900. If stocks rise in September and October, the incumbent party usually wins the presidency; if equities drop, the incumbent typically loses. “Out of the last 28 presidential elections, this simple indicator has proven correct 25 times. This is an astounding 89 percent success rate!”
Piper Jaffray found very similar results. The firm reviewed the S&P 500 performance for the three months prior to an election year since 1928. According to its study, the incumbent party won 11 out of 14 times when the S&P rose, and lost 6 out of 7 presidential elections when the S&P declined over the three months.
So why does this happen? It’s the market’s effect on Americans’ psyche. Adam says, “When the stock markets are strong so everyone feels better about the future, incumbents are more likely to win.”
Adam explains what many of us feel: When stock prices are rising, people are more optimistic, and spend more; when markets take a turn for the worse, people become concerned and spend less. “Not surprisingly, these behavioral changes spawned by our rising and falling portfolios also carry over into the voting booths.”
With this in mind, a market correction in the months coming up to the election means Americans will “naturally start getting worried and anxious,” says Adam. “So they start to look for a change in leadership to fix things, to improve the economy and their own chances for success. If an election happens then, they like to vote in new blood for change.” Read his article in it’s entirety.
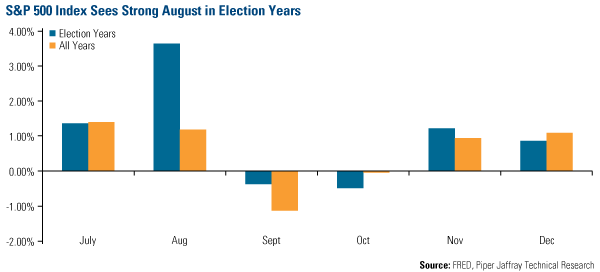
So how has the market typically performed? Going back to Piper Jaffray’s data, since 1928, August has historically been a “much stronger month” during election years as compared to all years. The S&P typically sees a return of about 1 percent in August; during election years, this number pops to about 3.5 percent. Also during election years, September and October have historically declined slightly.
In early August last year, the S&P dropped 12 percent in three days because of the unease over the eurocrisis and the U.S. debt downgrade. Both have parallels to what’s happening today, says Ed Hyman from ISI. He speculates that the U.S. will see a “repeat of 2010/2011, which implies a weaker economy for a few more months before improving in the fall.”
However, there are positive signs in the U.S. market today, with ISI pointing to an energy and tech boom, interest rates near zero and a cheap dollar. Also, U.S. consumers are reducing their debt burdens, with household debt as a percentage of disposable income having come off its high, and house prices in America are “among the world’s cheapest,” according to The Economist.
Disclaimer: This page contains affiliate links. If you choose to make a purchase after clicking a link, we may receive a commission at no additional cost to you. Thank you for your support!


Leave a Reply