As long as there have been markets, I am sure that investors have used screens to find good investments. It was Ben Graham, however, who systematized the process in his books on investing, by laying out the ten criteria (screens) that could be used to find cheap stocks.
- An earnings to price yield > Twice the AAA bond rate (At the AAA bond rate of about 3.6% today, that would work out to an earnings to price ratio > 7.2% or a PE< 14)
- PE ratio today < 40% of the highest PE ratio for the stock over the previous 5 years
- Dividend yield > 2/3 or the AAA bond yield (At today’s AAA rate, yield >2.4%)
- Stock price < 2/3 (Tangible book value of equity per share), where tangible book value of equity = Total book value of equity – Book value of intangible assets
- Stock price < 2/3 (Net Current Asset Value), where Net Current Asset Value = Current Assets – (Total Liabilities + Preferred Stock)
- Total debt < Book Value of equity
- Current ratio > 2, where current ratio = Current Assets/ Current liabilities
- Total Debt < 2 (Net Current Asset Value)
- Earnings growth in prior 10 years < 7%
- No more that two years in the prior ten, where earnings declined more than 5%.
While we can debate the efficacy of these screens (I, for one, find that the fixation on net current asset value is too restrictive), it is quite clear what Graham was looking for: cheap companies with low leverage & stable and growing earnings, with liquid assets acting as a backstop and providing a margin of safety for investors.
Do screens work?
Graham had three pricing screens among his ten criteria: PE ratios, a modified version of price to book ratios and dividend yields. In the decades since, studies (many from academics but quite a few from practitioners as well) have found that at least two of these screens seem to work, at least on paper. Stocks that trade at low PE ratios and low PBV ratios deliver returns that beat the market, on a risk adjusted basis.
Let’s start by reviewing the evidence. Rather than quote from studies that are at different points in time, I used the raw data (maintained very generously by Ken French at Dartmouth) to compute the differential returns that stocks, in the lowest and highest deciles of PE, PBV ratio and the dividend yield, earned on an annual basis between 1952 and 2010, relative to the overall market:
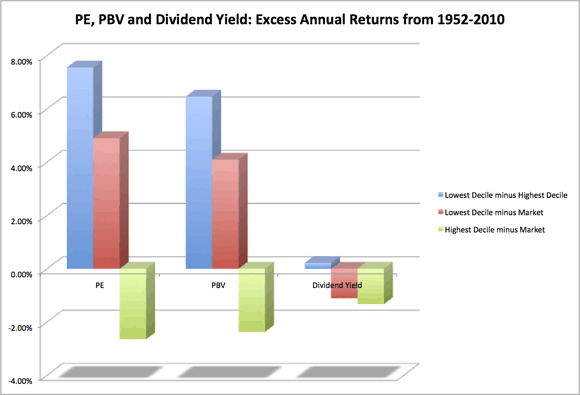
Note that low (high) PE and low (high) PBV stocks have beaten (under performed) the market by healthy margins, before adjusting for risk, over time but that there is no discernible pattern with dividend yields. In fact, over the period, non-dividend paying stocks beat both the highest dividend yield and lowest dividend yield deciles in terms of returns earned. You can find more on past studies by going to my paper on value investing.
So, what’s the catch?
When it looks like you can make money easily, there is always a catch. Here are the three caveats on the “excess returns” that a low PE, low PBV strategy seems to deliver.
- Time horizon matters: The returns are in the long term (five years and longer) and there are time periods (some lasting for years) where the strategies under perform the market. For instance, looking across the entire period, for instance, it looks like while low PE stocks dominate high PE stocks over long periods, the latter group outperforms during periods of low economic growth (where growth becomes scarce).
- A proxy for risk? While I did not adjust for risk in my computation for excess returns, most of the studies that have looked at these screens have controlled for risk, using conventional risk and return measures (betas, Sharpe ratio etc.). It is possible that there are other risks in buying these stocks that may not be full reflected in these risk measures. For instance, some stocks that trade at low price to book value ratios have high debt burdens and run a higher risk of default/distress.
- Transactions costs & taxes: A lot of strategies that make money on paper perform badly in practice because they expose investors to higher transactions costs and taxes. For instance, many of the stocks in the lowest PE ratio decile are lightly traded companies, with high bid-ask spreads and potential for price impact. Similarly, investing in high dividend yield stocks may expose investors to higher taxes.
In a testimonial to how difficult it is to convert paper profits to real profits, it is worth noting that the James Rea’s attempts to put Graham’s principles into practice in an investment fund that he ran from 1982 to the late 1990s was an abject failure, with the fund ranking in the bottom 20% of the fund universe in performance. In a similar vein, Value Line’s attempts to convert its screens (that also worked exceptionally well on paper) into a mutual fund also failed.
Incorporating screens into investing
If you do buy into the effectiveness of screens at finding cheap stocks, there are two ways to incorporate screens into your investing.
a. Bludgeon Screening: In this approach, all of the work in picking stocks is done by your screens. Thus, you start with a large universe of stocks and screen your way (using either more screens or tighter screens) down to a portfolio size (in terms of number of companies) that you are comfortable with.
b. Screening plus: You use the screens to narrow the universe of stocks (which may contain thousands of stocks) to a more manageable number, but you then follow up using one of these approaches:
- Screening plus intrinsic valuation: You value each of the screened stocks using an intrinsic valuation model (a discounted cash flow model, excess return model or your own variant) and invest in the most under valued companies. You can also incorporate a margin of safety into this approach by only investing in stocks that trade at 30%,40% or 50% discounts on your intrinsic value.
- Screening plus qualitative analysis: Once you have the screened list, you may be able to apply qualitative criteria that you think separate winners from losers (moats, good management etc.) to find the stocks for your portfolio.
A blueprint for screening
In Graham’s day, screening was an arduous process, with limited access to the financial statements of companies and no computing power. Today, screening has become easy with many sites offering stock screeners for all, sometimes at no cost: Yahoo! Finance, Google Finance and MarketWatch all offer simple screening tools. In fact, it has become so easy that investors sometimes get carried away, piling on redundant screens on top of each other and sometimes undercutting their effectiveness by doing so.
Before you start, be clear about your objective
You want to find a mismatched company, i.e, a company that is priced low, with none of the reasons for being priced low (high risk, low growth, low quality of growth). In other words, you want a stock trading at a low multiple, with low risk, high growth rates and high quality growth. What chance do you have of finding such a bargain? It may be low, but there is no harm looking.
Step 1 – Screen for price
The first step is to screen for low . With stocks, this will almost always require that you scale the market price to a common variable (revenues, earnings, book value etc.) to estimate a multiple. Here are your choices:
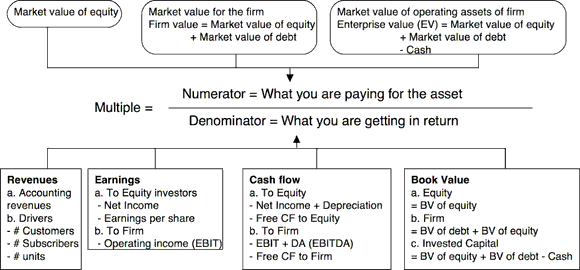
In making these choices, you have to be consistent. If your numerator is an equity value (market capitalization, stock price), your denominator should also be an equity value (net income, earnings per share, book value of equity). If your numerator is an enterprise or overall business value (enterprise value, value of firm), your denominator should be an overall firm number (operating income, EBITDA, revenues, book value of invested capital). Should you use an equity multiple or an enterprise value multiple? In some sectors, such as financial services, you have no choice but to use equity, since defining debt is close to impossible. In others, you have a choice, and here is my simple rule. If financial leverage varies widely across the sector (some firms have more debt than others), I would go with an enterprise value multiple. For comparisons across the entire market, enterprise value multiples tend to be more robust.
Once you have picked a multiple, you then have to choose your screening thresholds. In practical terms, you have to decide how low does a stock’s pricing multiple has to be to qualify for your cheap list. There are three ways to find this threshold.
a. You can use the rules of thumb that seem to be so widely prevalent: an EV/EBITDA less than 6 is cheap, a PE ratio in the single digits is low etc. While these rules of thumb may have made sense when first devised, it is doubtful that they make sense today.
b. You can derive the “cheap” threshold from intrinsic valuation models. To illustrate, the PE ratio for a firm that pays its entire earnings out as dividends and has no growth should be as follows:
Intrinsic “cheap” PE threshold = 1/ Cost of equity
In June 2012, when the cost of equity was computed to be about 8%, the threshold for a “cheap” company would be 12.5 (=1/.08).
c. You can derive the threshold by looking at the distribution of the values of the multiple across your sample, using the lowest decile (or lowest quartile) as your cutoff for “low”. The table below lists the deciles for key multiples for US companies in January 2012:
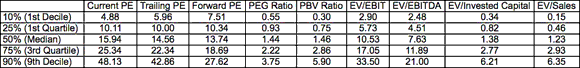
Thus, looking for stocks with a PE less than 5 would give you stocks in the lowest decile whereas using a cut off of 10 for the PE would give you stocks in the top quartile, at least in early 2012.
Step 2 – Screen for risk
Companies that are very risky can look cheap, without being cheap. To screen for risk, consider first a breakdown of risk into three categories:
(a) Operating risk, reflecting the risk that your revenues and costs can shift over time, as the market and the sector evolve.
(b) Financial risk, coming from the use of debt, leases and other fixed commitments that can make your residual stake as the equity investor much more volatile.
(c) Liquidity risk, that you face as as investor when trading on the stock, manifested as trading costs (bid ask spreads, price impact) and inability to trade at the extreme.
The screens for risk can broadly be categorized as follows:
- Price based screens: While many value investors express disdain for betas, there are other price based screens that are based upon prices (standard deviation, volatility in the stock price) that they may still be willing to use as measures of composite risk. In fact, you can use screen for liquidity risk, using market data, by looking at the bid-ask spread or the trading volume/float in a stock.
- Accounting based screens: Accounting statements can provide snapshots of risk, though they are stronger in measuring some types of risk than others. You can measure exposure to financial risk fairly well, using ratios that measure the capacity to make interest or debt payments (interest coverage, fixed charge coverage ratios), operating risk less well (variability in earnings over time) and liquidity risk not at all.
- Risk proxies: While this may be applying a broad brush, you may use the sector a firm is in as a proxy for risk; thus technology companies may be viewed as risky companies and utilities as safe companies. Alternatively, you may believe that large companies (measured in market capitalization or revenues) are safer than small companies.
- Sector specific screens: If you are screening for cheap stocks within a sector, you may use measures of risk that are specific to the sector. Among bank stocks, for instance, you may look at regulatory capital ratios or exposure to problem assets/businesses; banks with lower regulatory capital or greater exposure to toxic assets are riskier.
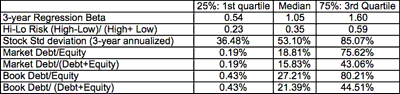
As with the multiples, you can see the quartiles of the distribution for these variables for US stocks in January 2012 in the table below:
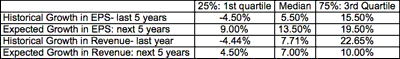
Step 3- Screen for growth
If you are a value investor who views growth as icing on the cake, you may not look for high expected earnings growth but you may still want to screen for companies with moderate growth prospects or at least try to avoid companies with negative earnings growth. In screening for growth, you should stay true to the consistency principle, focusing on growth in equity earnings, if you are using an equity multiple (like PE) or growth in operating earnings, if you are using an enterprise value multiple and you would rather be forward looking in your growth estimates (using expected future growth, if available) rather than backward looking (historical growth). The quartiles of growth measures for US stocks in January 2012 is in the table below:
Step 4 – Screen for quality of growth
If you are employing a growth screen, you also want to ensure that the firm is not spending too much to deliver that growth. To screen for quality of growth, you can employ one of two approaches:
a. Accounting return measures: Dividing the accounting earnings by accounting book value gives you a measure of accounting returns:
Return on equity = Net Income/ Book value of equity
Return on invested capital = Operating income/ (Book value of equity + debt – cash)
While they are aggregate measures for the whole firm and accounting earnings/ book value are susceptible to accounting manipulation, you want firms that are able to earn high returns on their growth investments in your portfolio. At the minimum, the returns should exceed the costs (the cost of equity, if ROE, and the cost of capital, if ROIC).
b. Sector specific measures: You can also measure efficiency of growth using sector specific measures, such as profit margins (net or operating) in retail, capital invested per subscriber (in cable or other subscriber-based businesses) or capital invested per kWh of power produced (for power companies).
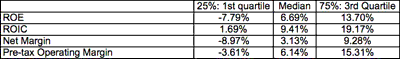
The quartiles for ROE, ROIC, net and operating margin for US companies in January 2012 are reported in the table below:
Step 5: Rinse and repeat
Once you run your screens, check the stocks that come through the screens for two potential problems. The first is sample size. If your screens return only a handful of stocks, your screens have been set too tight and you should consider relaxing one or more of your screens (settling for lower growth or higher risk). The second is sector concentration. If you end up with stocks that are in one or a couple of sectors, you may want to consider modifying or adding to your screens to get more diverse portfolios.
While you can screen for free at Yahoo! Finance and Google Finance, you get far more flexibility in defining your own screens if you have access to a database. For US companies, you can try Value Line or Morningstar, both of which provide real time data for the entire universe of traded stocks and are not unreasonably priced. For screening of stocks outside the US, you can use Capital IQ, Factset or Bloomberg, but the price tag gets higher. There are some innovative sites out there that are offering better screening tools and large databases, such as RobotDough, a site that combines an impressive database with powerful screening tools, AAII and Zacks(which has a combination of free and premium screens).
Odds of success
I have always believed that, as an investor, you need to bring something unique to the table to be able to take something away in terms of excess returns. In other words, just as we look at competitive moats for successful businesses, you have to think about your competitive moats as an investor. With screening, consider the competitive advantages that Ben Graham saw for the intelligent investor in 1951, when he put together his classic screen list. The first was access. With limited access to financial statements and no easy-to-use tools, only a few tenacious investors could use these screens. The second was discipline. Investors had to stay away from distractions and fads and stay true to those stocks that made it through the screens. The third was patience. Investors had to hold the screened stocks in the long term to generate the promised returns. Today, with widespread access to data and analysis tools , the first advantage has dissipated, leaving behind patience and discipline as your potential advantages. It can be argued that an automated screening/investing process, with no human input, is less likely to succumb to emotion than the most disciplined, patient human being. Put more bluntly, if all you have to offer as an active investor is screens, you are unlikely to beat a machine doing the same. With screening plus, whether you make money depends on the quality of what you do after you screen. If you are skilled at intrinsic valuation or qualitative assessment, you may generate excess returns, relative to the market.
In closing
To illustrate the screening process, I used Capital IQ data and used two sets of screens to arrive at a list of “cheap” stocks from a universe of 7542 publicly traded companies in the US.
Equity screen: Low PE (<10.11, in bottom quartile), above-average expected EPS growth rate (>13.50%, above median), below-average book debt to equity ratios (<27.21%, in bottom quartile), high ROE (>13.60%,top quartile) –> See the 19 stocks that made it through these screens
Enterprise value screen: Low EV/EBITDA (<4.51, bottom quartile), above-average expected revenue growth (>7%, above median), below-average book debt equity ratio (<27.21%, below median), above-average ROIC (>9.41%, top quartile) –> See the 13 stocks that made it through these screens
I would not be rushing out to buy all of the stocks on either list, but I think it is worth following through and doing intrinsic valuations of these companies. Anyone up for it? If so, you are welcome to use my generic valuation spreadsheet.


Leave a Reply