This Wall Street Journal chart shows last week’s performance of different major global financial markets.
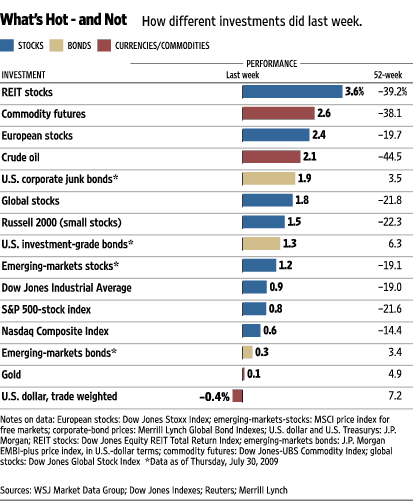
As the chart above illustrates, REIT’s continued to dominate the performance spectrum convincingly over the last week ; gaining over 3.6%, followed by Russell 2K’s 2.6% and Euro Stocks’ 2.4%. Excluding greenback’s 0.4 percentage points deterioration, all asset classes gained. On a y/y basis however, the majority of them continue to remain in red with crude topping the list at -44.5%.
Graph: WSJ
Disclaimer: This page contains affiliate links. If you choose to make a purchase after clicking a link, we may receive a commission at no additional cost to you. Thank you for your support!
Leave a Reply