Robin Hanson writes:
On the criteria of potential to help people avoid death, this would seem to be among the most important news I’ve ever heard.
[In his recent Ph.D. thesis, Ken Lee finds that] death rates depend on job details more than on race, gender, marriage status, rural vs. urban, education, and income combined! Now for the details.
The US Department of Labor has described each of 807 occupations with over 200 detailed features on how jobs are done, skills required, etc.. Lee looked at seven domains of such features, each containing 16 to 57 features, and for each domain Lee did a factor analysis of those features to find the top 2-4 factors. This gave Lee a total of 22 domain factors. Lee also found four overall factors to describe his total set of 225 job and 9 demographic features. (These four factors explain 32%, 15%, 7%, and 4% of total variance.)
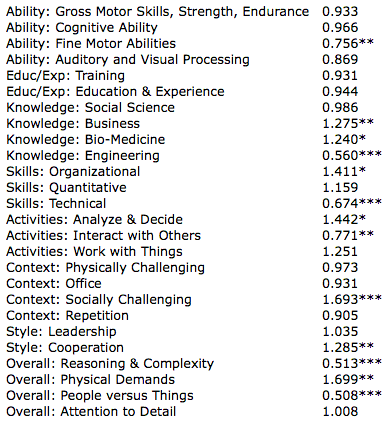
Lee then tried to use these 26 job factors, along with his other standard predictors (age, race, gender, married, rural, education, income) to predict deaths in the 302,890 people for whom he had job data. Lee found that his standard predictors didn’t change much, and found these job factor risk ratios (Table 34, column 2):
Ten of the 26 estimates are 5% significant, and five are 1% significant – this isn’t random noise (*** p<0.01, ** p<0.05, * p<0.1). Each factor is scaled to range in value from 0 to 1 across the 806 occupations; its risk ratio is an estimated ratio of death rates when that factor has its max value of one, relative to death rates when that factor has its min value of zero. And these are huge risk ratios!
If you take all of Lee’s standard non-age predictors (race, gender, married, rural, education, income), and multiply together their risk ratios, you’ll find that a poor badly-schooled unmarried urban black male dies 17.7times as often as a rich well-educated married rural asian woman (of the same age), with a lifespan roughlythirty years shorter on average. (A risk ratio of 1.57 costs roughly five years of life.)
Yet big as this effect is, the top five job factor risk ratios give a total ratio of 19.7, bigger that all the other non-age effects put together! And the top ten job factor ratios give a total risk ratio of over 100! (All twenty six factors together give a total risk ratio of 563.) Jobs are clearly a huge and neglected influence on who lives and who dies.
Hanson summarizes:
If you cared about preventing death, rather than just signaling your concern, these results suggest you stop wasting your efforts on tiny effects like medical insurance, auto accidents, crime, recreational drugs, radiation, or food safety, and focus on: jobs. Yes a lot of job-death variation must come from different types of people doing different types of jobs, but a great deal of this variation is also likely causal – some jobs kill folks much more than others.
At the very least we should try to tell people about the huge life and death consequences of their job choices. Then workers could demand higher wages for more deadly jobs, which should induce employers to seek ways to substitute less deadly for more deadly jobs.
I’m suspicious of that factor of 19.7, though–I think you can get big numbers when you multiply together noisy estimates. In any case, the general point is interesting. Especially in light of the recent NYT story reporting that reseachers attribute much of obesity to sedentary jobs, moving the focus away from home life to work life.


Leave a Reply