Since the start of the year, the price of crude oil has risen about 40% while the price of natural gas has fallen by about 40%. Can that divergence be maintained?
A barrel of oil has about six times the energy content of a thousand cubic feet of natural gas. The graph below compares the dollar price of a barrel of oil with the oil-equivalent cost of natural gas, calculated by multiplying the price (in $/1000 cu ft) by six. The two prices tended to move together in the early part of the decade, but have diverged significantly over the last few years, with natural gas today selling for 1/3 the price of oil in terms of BTU content.
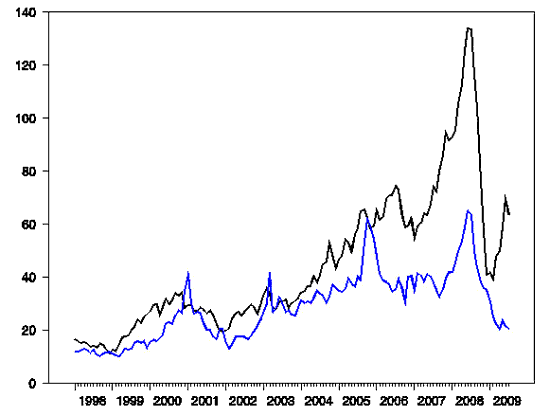
Black line. Jan 1998 to Jun 2009: average price over the month of West Texas Intermediate, in dollars per barrel (from FRED). Jul 2009 entry is spot price on July 17 (from WSJ). Blue line. Jan 1998 to April 2009: six times the U.S. natural gas wellhead price (from EIA). May to Jul 2009: six times estimated Henry Hub spot price (from WTRG).
Does this mean that oil prices will go down, natural gas prices will go up, or both? Let Δot denote the monthly percent change in in oil prices (technically, the change in the natural logarithm) and zt the percentage gap in cost (technically, zt = ln(ot/6gt)). If you use a regression to try to predict oil prices from their own lagged values and the lagged oil-gas cost gap, a positive gap such as we have at the moment does tend to tug down future oil prices slightly, though the coefficient is not statistically significant. Here are the regression coefficients, with standard errors in parentheses:
On the other hand, the cost gap does seem to help significantly to predict where natural gas prices might go. With the gap currently at zt = 1.13, the historical regression below might lead you to expect natural gas prices to climb by 10% a month (0.103 x 1.13 = 0.116) until the gap is closed.
But it’s hard to see that happening in the face of news like this:
Natural gas prices have been pummeled by over-supply and weak demand, cutting the national drill rig count in half in the past year. Meanwhile, monstrous initial production rates in non-traditional shale plays have added to price pressure, as producers fight to hold the terms of their expensive leases in boomtowns….
Now, British Columbia’s Horn River Basin might be added to the list, with the help of behemoth ExxonMobil (NYSE:XOM) reportedly coming up with initial rates on early test wells to the tune of 16- to 18-million cubic feet a day…. That is double the rate of a really good well and in line with the Haynesville, in Louisiana, which may hold some 250 trillion cubic feet of recoverable national gas, enough to satisfy domestic demand for a decade.
So maybe that negative coefficient in the first regression will do some work after all, tugging oil prices down. In the mean time, trends like this are worth encouraging:
Mass transit buses have operated on natural gas for years and in other countries for decades. According to NGVAmerica, some 125 transit agencies are now operating over 10,000 natural gas transit buses on American highways. This trend is expanding, with over 20 percent of all new bus orders offering natural gas propulsion.

Leave a Reply