The IMF claims that European banks are in need of capital injections; the ECB disagrees. This column looks at the issue from a different angle. It uses daily bank stock price data to calculate a volatility connectedness index as a measure of how shocks to bank share prices are spread to others. As of 7 September, the index reached its historical high, indicating that major European bank stocks are connected in a state of high volatility.
IMF chief Christine Lagarde recently argued forcefully for forced capital injections to major European banks in order to stop the spread of the Eurozone’s sovereign debt and financial crisis. Jean-Claude Trichet, the president of the ECB, responded that European banks faced a liquidity shortage, which the ECB was already busy at work preventing.
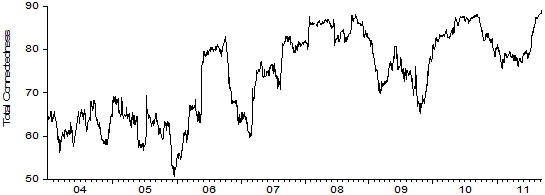
Both sides of the debate used detailed balance-sheet data and came up with different conclusions about the current state of the European financial system. In recent research (Diebold and Yilmaz 2011), my co-author and I use daily stock price data for 14 major Eurozone and Swiss banks to develop a measure of systemic risk in the European financial system.1 The measure, the total volatility connectedness index, is presented in Figure 1 for the period from 1 January 2004 to 16 September 2011.
Figure 1. Total volatility connectedness among the major European Banks2
The connectedness-index framework is based on the decomposition of the forecast error variances obtained from a vector autoregression. It allows us to identify the extent to which a shock to one asset (its return or volatility) affects other assets included in the analysis. It is a simple framework to implement. The single index value ranging between 0 and 100 measures the percetage of the forecast error variances of all 14 bank stocks that is explained by shocks to other bank stocks in the sample.
The intensity of volatility shocks as well as the transmission of these shocks across major bank stocks are likely to vary over time. Rolling the 100-day sample windows over time and calculating the connectedness index for each window, I allow the index to capture any possible time variation in cross-stock effects of return volatility.
As of 7 September, the volatility connectedness across the 14 leading banks in six Eurozone countries (Belgium, France, Germany, Italy, Netherlands, and Spain) and Switzerland has reached the historically high level of 89% and has stayed around that level since then.
The total volatility–connectedness index started out at 64% as of January 2004 and never declined below the 50% that was attained in December 2005. After a relatively tranquil period in 2004 and 2005 the index fluctuated widely over time. The Federal Reserve’s May 2006 decision to increase the Fed Funds target rate by another 25 basis points triggered an increase in volatility across many asset classes. Then, in March 2007 the first signs of the subprime crisis appeared, followed by the liquidity crisis of August 2007, the Black Monday in world stock markets on 21 January 2008, and the collapse of Lehman Brothers on 15 September 2008.
In each of these instances the volatility-connectedness index jumped. However, because of its construction the index is bounded from above at 100%. The higher the index climbs or jumps, the smaller will be the size of the step. For example, starting from a low base of 60%, the index jumped 11 points when the first signs of the sub-prime crisis started to appear on 2 March 2007. At the height of the global financial crisis on 15 September 2008, on the other hand, the index increased by only four percentage points.
As markets calmed down in December 2008 and January 2009, the index declined to 70%. However, the problems in the US banking industry and especially the expectations about the stress test results increased the volatility in US and European bank stocks in April and May 2009.
Once the stress test results for the US banks were announced on 8 May 2009, the volatility connectedness of the Eurozone banks gradually declined to as low as 65% in mid-October. However, the news about the Greek government’s huge hidden budget deficit and unsustainable sovereign debt started to be revealed in November 2009. Accordingly, the volatility connectedness of the major Eurozone banks started to increase, reaching 87% by 10 May 2010 as EU leaders failed to implement a viable solution to the Greek debt crisis. Even though, under pressure from the markets, EU leaders agreed on a solution, thanks to fresh worries about Ireland and Portugal the bank stocks’ volatility connectedness failed to decline until the last quarter of 2010.
When the total connectedness index declined in late 2010 and early 2011, it did not fall below 75%. The new plateau of 75% that was settled after the markets had become more tranquil, however, was not very assuring, especially when one compared it with the low point of 65% that was reached after the global financial crisis in the second half of 2009. Once the worries about the Spanish and Italian debt started to put increasing pressure on the bank stocks from late June onwards, the index started to increase again, reaching its highest level at 89% on 7 September.
Next I want to focus on the net directional connectedness, which can be defined as the difference between the shocks transmitted to others and shocks received from others. When it is positive the bank is a net transmitter of shocks to others. When it is negative the bank is a net receiver of shocks from others. Figure 2 presents the net directional connectedness of each of the 14 major European banks in 2011.
Figure 2. Net directional volatility connectedness among major European banks in 20113
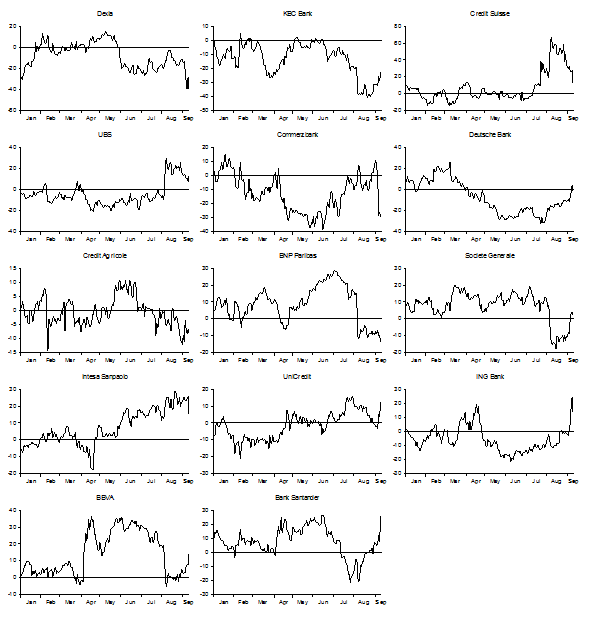
French and Spanish banks have positive net connectedness for most of 2011. Banks from Belgium, Germany, the Netherlands, and Switzerland had low or negative connectedness for most of 2011. Among the Italian banks, Intesa Sanpaolo moved from negative to positive net connectedness territory since May. After a decline in late August, the net directional connectedness of UniCredit Group jumped by more than 10 percentage points in the first week of September.
On 5 August 2011, the media reported the ECB’s decision to buy Italian and Spanish bonds in exchange for fiscal reforms. This decision, however, did not have any impact on the upward trend of the total connectedness index. The index continued to increase in the rest of August. Instead it affected the directional connectedness of individual bank stocks. On that day, the net directional volatility connectedness of BNP Paribas and Societe Generale, BBVA, Bank Santander and the KBC Group declined significantly.
More importantly, on 5 August the net directional connectedness of two major Swiss banks shot up, making Credit Suisse (with 62% net connectedness) and UBS (with 25% net connectedness) the top contenders for directional connectedness to others. These banks were exposed to Greek, Italian, and Spanish debt as well as the debt of other countries in the Eurozone periphery. While the volatility of the Eurozone banks declined after the news about the ECB’s decision came out, the volatility of the Swiss banks continued to increase substantially. However, following the Swiss National Bank’s more assertive interventions in the foreign exchange markets that finally culminated in pegging the Swiss franc to the euro, the net directional connectedness of both banks declined steadily significantly to around 10%.
Almost one week after the ECB’s decision, on 11 August the governments of Belgium, France, Italy, and Spain agreed to ban the short selling of financial stocks. Even though this decision helped keep the net connectedness of the bank stocks of these countries low, its impact was only temporary. The total volatility–connectedness index continued to stay high, reaching its highest level of 89% on 7 September 2011. Furthermore, two Spanish banks, BBVA and Bank Santander, experienced significant jumps in their net directional connectedness in the first week of September that ended on 9 September. While BBVA’s connectedness reached almost 15%, the connectedness of Bank Santander increased as high as 30%.
To conclude, the analysis of volatility connectedness among the largest EU banks provides a clear indicator of the difficult times the European financial system is experiencing.4 The banks in the EU and Switzerland are tightly connected in a state of high volatility. There is not much time left for the European leaders to get their act together and come up with a once-and-for-all solution before the debt crisis spreads from the periphery to the core, bringing down many European banks on the way.
References
•Acharya, V, L Pedersen, T Philippe, and M Richardson (2010), “Measuring Systemic Risk”, Manuscript, Stern School, New York University.
•Adrian, T and M Brunnermeier (2008), “CoVaR”, Staff Report 348, Federal Reserve Bank of New York.
•Diebold, FX and K Yilmaz (2009), “Measuring Financial Asset Return and Volatility Spillovers, with Application to Global Equity Markets”, Economic Journal, 119:158-171.
•Diebold, FX and K Yilmaz (2011), “On the Network Topology of Variance Decompositions: Measuring the Connectedness of Financial Firms”, Manuscript, University of Pennsylvania and Koç University.
__________
1 In recent literature, several alternative approaches have been proposed to measure the contribution of each financial institution to the systemic risk. Among these, CoVaR approach of Adrian and Brunnermeier (2008) and the marginal expected shortfall approach of Acharya et al. (2010) received quite some attention.
2 The weekly updates of the connectedness plots can be reached at http://www.financialconnectedness.org
3 The weekly updates of the connectedness plots can be reached at http://www.financialconnectedness.org
4 When I repeat the analysis after including four British banks (Barclays, HSBC, Lloyds and RBS) to the original list, I obtain total and net directional connectedness measures that are very similar.
![]()


Leave a Reply