Perhaps we shouldn’t.
The idea behind a poverty rate is that we set an income line below which people’s resources are deemed insufficient for a minimally decent standard of living. The poverty rate is the share of people in households with income below that line.
Because it’s a binary measure, it’s a crude one. Suppose a lot of the poor at time 1 have incomes just below the poverty line. The economy then improves, or the benefit amount for a government transfer program is increased, so at time 2 a number of those people have moved above the line. It will appear that poverty has been sharply reduced, even though the amount of genuine progress is small. Similarly, suppose a number of people who formerly had very low incomes move into the work force and experience an income rise, but that rise doesn’t quite get them above the poverty line. This is a significant improvement, but it won’t show up at all in the poverty rate.
This problem is well known among social scientists. Some therefore also calculate the “poverty gap” — the distance between the poverty line and the average income of those below the line. To that we can add inequality among the poor. Measures exist to incorporate either or both of these. But they are complicated and thus difficult to communicate to a nontechnical audience. One common measure, for instance, is the poverty rate multiplied by the poverty gap. This is better than the poverty rate by itself, but the numbers yielded by the measure don’t have an intuitive feel.
Another problem with poverty rates is that much hinges on where the line is drawn, so we end up mired in interminable debates about exactly where that should be (here, here).
Is there a useful alternative? I think so.
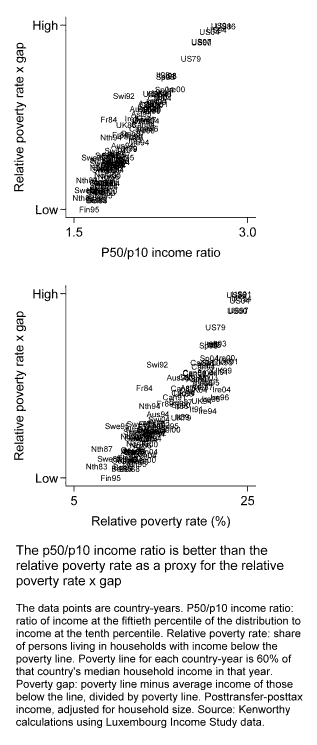
Instead of a relative poverty rate, such as the official measure used by the European Union, I recommend the p50/p10 income ratio. Relative poverty is essentially a measure of inequality within the lower half of the distribution, so why not use a measure that more clearly conveys that? The 50/10 ratio is an inequality measure already familiar to social scientists, and it’s fairly simple to explain and understand. And as the first of the following two charts shows, the 50/10 ratio is very similar to the poverty rate multiplied by the poverty gap (the correlation is .96). The second chart shows that the poverty rate is a less effective proxy for the rate x gap.
Instead of an absolute poverty rate, such as the official poverty measure in the United States, we can use absolute household income at the tenth percentile (p10) of the distribution. Across countries and over time, this measure is very similar to the absolute poverty rate multiplied by the absolute poverty gap. But it’s much simpler and easier to comprehend. Also, it’s a low-end analogue to median (p50) household income, a common indicator of the living standards of the middle class.
Why the tenth percentile rather than the fifth or the fifteenth? Actually, I’d prefer the fifth, but there sometimes is reason to worry about data quality as we get close to the very bottom of the distribution. The tenth is reasonably close but not too close to the bottom, it’s a nice round number, and it already is commonly used in inequality measures such as the 50/10 ratio and the 90/10 ratio. But in truth, the choice of the tenth is arbitrary; it’s no more representative than the seventh or the twelfth or any other point at the low end of the distribution.
So we have good alternatives to the two most common poverty rate measures. But what about political impact? Isn’t the poverty rate a helpful tool in pressing policy makers to keep their eye on the least well-off? Maybe. Yet hardly any of Europe’s rich nations had an official poverty rate measure prior to the EU’s introduction of one a decade ago, while here in the U.S. we’ve had an official poverty rate for nearly half a century. The absence of an official poverty rate doesn’t seem to have impeded government commitment to the poor in Europe. And I’m not sure the presence of one has helped a whole lot here.
I don’t expect policy makers or social scientists to stop using poverty rates any time soon. And it won’t be disastrous if they don’t. But we could do better.


Leave a Reply