There’s an old contrarian investing maxim from Baron Rothschild that says “the time to buy is when there’s blood in the streets, even if the blood is your own.” The idea is that the best investors strategize when others panic, allowing them to buy stocks on “sale.” The legend of Warren Buffett was built on this philosophy during the market turmoil of the mid-1970s.
There was more “blood in the streets” Monday as the world continued to digest S&P’s downgrade of U.S. debt, the two-week market selloff, and the likelihood the U.S. economy could possibly slide back into recession. These concerns, combined with continued political/economic struggles in the eurozone from socialist policies, have created a potent concoction of fear across global markets and sent volatility skyrocketing Monday to its highest level since the May 2010 “Flash Crash.” While many investors are running for the exits, others have chosen to ride the wave of volatility or buy depressed shares.
The S&P 500 Index has fallen 15 percent since July. This has happened only fives times since 1960: The 1987 Crash, the Asian financial crisis in 1998 and twice in 2008, according to research from Desjardins. In each of these instances, markets gained an average 9 percent the following month.
The CBOE Volatility Index (VIX) rose more than 46 percent to break the key 40 level, signaling an extreme event. In general, any time the VIX rises above 30 indicates conditions are volatile. Above 40, it’s clear the only thing at a premium in this market is fear.
The S&P 500 isn’t the only investment that’s been experiencing extremes. A flood of safe-haven buying this week sent gold prices up more than $80 an ounce (about 5 percent) to $1,746.73 at market close Friday. Gold prices are up over 43 percent for the past year and roughly 11 percent the past 30 days. The increase over the past month is roughly equal to gold’s normal volatility over an entire year and is a short-term risk for a minor correction in a secular bull market.
Meanwhile, oil (along with oil-related equities) has been bludgeoned down to price levels not seen in a year—off almost 25 percent from April 2011 highs. Other commodities such as copper, wheat and cotton have also taken sizable haircuts over the past two weeks.
Such market turmoil creates a real challenge for investors who are in it for the long haul. Investors must control their emotional response and remain on the lookout for opportunities. Equity performance and fear-driven volatility carry a strong inverse correlation. This chart shows sharp spikes in the VIX trigger an autonomic selloff in the S&P 500. However, these selloffs have historically resulted in strong rebounds, thus providing an opportunity for clever investors who like to buy their summer clothes during a winter sale and their winter clothes during the summer.
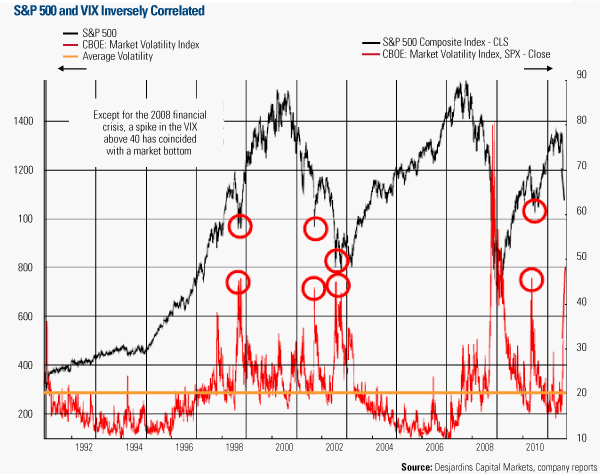
Before Monday, the VIX closed above the 40 level five times since 1995, and in all but one occurrence the market was at higher levels just three months later. The exception is 2008, when the VIX passed 40 on its way to 90 and remained elevated for months during the worst financial crisis since the Great Depression.
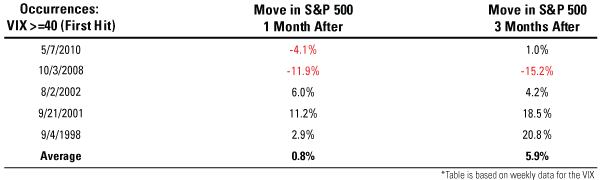
You can see from the table that the market has rebounded roughly 6 percent on average over the three-month period after hitting the 40 mark. Short-term reactions are more mixed. The market has swung 11 percent in either direction during the next month of trading and the average gain is only 80 basis points.
For the purposes of this exercise, the analysis is based on weekly data from August 8, 1995 through August 8, 2011. There were stretches of time, such as in 2008, when the VIX remained above 40, but we’re only counting the initial breach.
With this in mind, investors must remember there are some good opportunities out there and we’re working relentlessly to find them. Some of the best are in great American companies, whose balance sheets are the envy of Washington, with many carrying dividend yields above the 10-year Treasury bond. Currently, the 2.18 percent yield for the S&P 500 is the highest level since July 2009, Desjardins says.
A similar phenomenon took place following banking crises in France, Sweden and the U.S. during the 1990s. Without the ability to tap banks for additional capital, companies moved to large positive cash-flow positions and self-financed their growth, according to GaveKal research. These strong capital structures provided the foundation for the market’s bull run during the back half of the decade.
This opportunity has largely been ignored as investors have fled like lemmings to the “safety” of cash, government bonds and money market funds. These investments “afford zero prospects for capital gains and only microscopic income,” says Murray Pollitt from Pollitt & Co.
This mad dash for cash is driven by fear and investor desperation to preserve their money rather than make any. Naysayers have been flippantly labeling gold a bubble since it reached $500 an ounce, but have turned a blind eye to the unprecedented amount of “money pouring into government bits of paper” that is the “biggest bubble of all time,” says Pollitt.
History is filled with cycles and each asset class carries its own DNA of volatility. Those who are highly leveraged or those forced to sell in order to raise capital are experiencing the most pain right now. Investors not in those two camps must remember that the markets are cyclical, just like the tide, which comes in and out each day, and the moon, which cycles every 29 days.
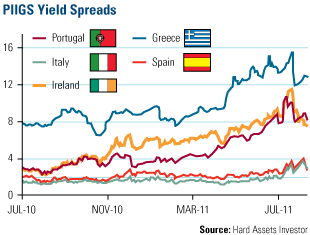
We expect gold to continue its pullback in the short-term as prices have become overextended. However, the long-term story remains firmly in place. HSBC says “If history is any judge, the decade-long gold rally will not end until sovereign risks—inside and out of the U.S.—recede.” The yield spreads for the majority of PIIGS (Portugal, Italy, Ireland, Greece, Spain) are well above historical norms, signaling the market has little confidence their sovereign debt issues will be solved any time soon.
Gold also measures out at relatively low levels when compared to other measures of economic growth/wealth over the past several decades. The chart on the left from Deutsche Bank compares gold prices relative to the S&P 500. Even though gold has appreciated against equities over the past decade, it is significantly cheaper than it was during previous bull runs in the 1930s and 1970s. Assuming no change in the S&P 500, gold prices would have to appreciate to $6,400 an ounce in order to reach the peak levels of the 1980s, according to Deutsche Bank.
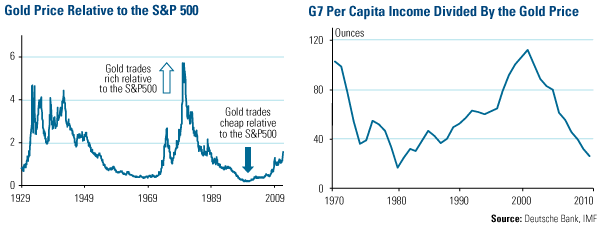
Gold also has room to run before reaching a new high relative to G7 per capita incomes. Since 1970, an average consumer in one of the G7 countries (Canada, France, Germany, Italy, Japan, the U.K. and the U.S.) has been able to buy 69 ounces of gold with their annual income. Current G7 incomes would purchase only 26 ounces if gold prices averaged $1,550 an ounce. In order to reach lows set in the 1970s, gold prices would have to rise to $2,410 an ounce.
This week, HSBC said gold can rise to $1,850 an ounce this year and average $1,625 an ounce in 2012. One area that could directly benefit from gold prices maintaining such historically high levels is gold equities. The share prices for miners have lagged bullion significantly this year, pushing the gold-to-XAU ratio to the second-lowest level in nearly 30 years in June. Gold stocks also have a history of performing well when the U.S. economy hits a bump in the road. Depression-era babies might remember gold stocks’ strong performance during the 1930s.
This lag sets the stage for a possible strong rally in gold equities relative to bullion once mean reversion to historical levels kicks in, just like it has done time and time again. Desjardins notes that one current catalyst for a rebound in gold stocks is increased profitability from rising gold prices and decreased input costs due to oil’s 28 percent decline off of 2011 highs.
In addition, many quality gold companies are “paying investors to wait” by increasing dividend yield rates above those of money funds. This creates a cash incentive to hold shares of the company and allows investors to participate in rising earnings.
A key question for the global economy is: Who will lead a recovery in global markets? Where will growth come from?
With trillions of dollars in debt acting as a ball-and-chain for much of Europe, the U.S. and the rest of the developed world must detoxify their balance sheets before hitting the ground running. On the other hand, emerging market economies carry low levels of debt and operate like a cash business, making them the final frontier for strong economic growth.
A key reason is emerging market governments have the long-term policies in place to facilitate growth of their economies. GaveKal points out it’s unlikely we’ll get a second dose of large stimulus like we did in 2008-2009 because of inflationary pressures, but that magnitude of assistance isn’t needed. Because China and other emerging market governments focused their stimulus on job creation and infrastructure development, their roads to economic growth have already been paved.
This will allow them to flex their economic muscles during short-term instability and insulate them from the turmoil. This is why we think emerging markets will continue to shine for many years to come.
Take China’s $300+ billion commitment to construct a nationwide high speed rail network, for example. The project is already paid for and will invigorate consumption across all sectors of the economy by connecting 700 million people across 250 cities. The recent accident was a terrible tragedy but the country is not going to abandon its plans. Rather, China will learn from the setback and push forward with better safety standards.
While the investment herd rushes into CDs and other “zero” yielding investments, nimble-minded investors can use these cycles to seize current opportunities and position portfolios for when the bull market tide returns.


Leave a Reply