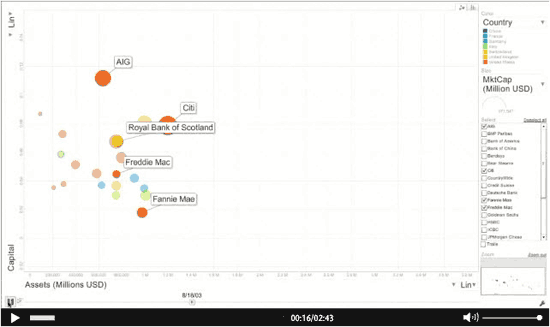
CFR’s Brad Setser presents in the following clip four Google motion graphs. Each chart tracks a statistical trend that will help provide some insight into the origins of the current financial crisis.
Click for video
Disclaimer: This page contains affiliate links. If you choose to make a purchase after clicking a link, we may receive a commission at no additional cost to you. Thank you for your support!
Leave a Reply