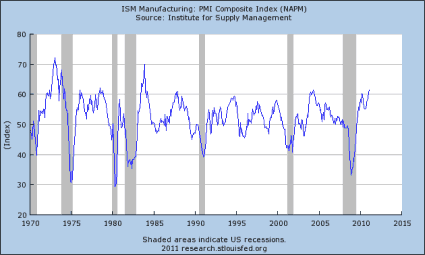
The Institute for Supply Management’s (ISM) manufacturing index rose to 61.4 in February from 60.8 in January. This was also a positive surprise as the consensus had been looking for the index to dip slightly to 60.5.
The overall index last matched this level in May of 2004, and the last time that it was higher than this was back in December of 1983. This is a “magic 50″ index, where any reading over 50 indicates that the manufacturing side of the economy is expanding and any reading under 50 indicates a contraction in manufacturing. The overall index has now been above the magic 50 mark for 19 straight months.
The key take away from this number is that the manufacturing sector is expanding, and doing so at a faster rate than in January. This reading is extremely strong by any historical perspective. In fact, it has been matched or exceeded in only 77 months since the start of 1948, or 10.2% of the time. Almost all of those instances are ancient history.
Since 1980, the current level has been matched or exceeded only 6 times, or than 1.6% of the months. It is up from a low of just 33.3 in December of 2008. The graph shows the history of the overall index since 1970.
Sub-Indexes All Show Improvement
The ISM index has a very long and venerable history, it used to be known as the Purchasing Managers Index or PMI. The overall index is made up of ten sub-indexes. All of the indexes showed improvement over last month. Eight are above the magic 50 level, the index tracking purchasing managers views of their inventories, and of their customers inventories are the only exceptions.
If I had to pick any two of the indexes that I would want to see below 50, it would be those two. Remember that drawing down inventories was a major drag on growth in the fourth quarter. So companies seeing their inventories as being too low is not all that surprising, nor is it particularly bad news.
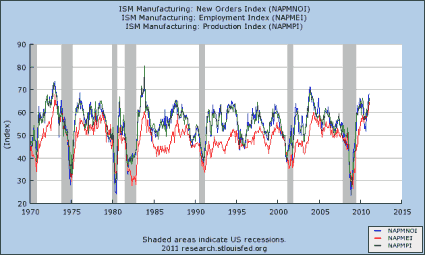
The sub-indexes are as interesting as the overall index. When one digs below the headline number, this is a very solid report. In terms of the current state of the economy, the most important of these is the production index. It rose 2.8 points to 66.3, which is the highest it has been since last April. Prior to that, the last time it had been this high was in April of 2004.
The production index has been in positive territory for 21 straight months now. Its low point was in December of 2008 at 23.7. Twelve industries reported an increase in production while three saw production fall in January.
However, the index with the biggest impact on the very short-term is the backlog of orders, and there the picture is also one of improvement. The order backlog sub-index rose 1.0 point after it soared 11.0 points in January. That is a good thing since order backlog had been one of the problem areas, having spent the last four months of 2010 below the 50 level. The current reading is the highest since last May. Ten industries reported an increase in January, while two reported declines.
Looking just a bit further out, as existing orders in the backlog are worked off, they need to be replaced with new orders. The new orders sub-index thus gives us the best view of where things will be in the next few months. The new orders index climbed to 68.0 from 67.8.
In other words, new orders are flooding in to the nation’s factories. New orders have been on the rise for 20 straight months now. This is the highest level for this sub-index since January of 2004. It is up from a low of 23.7 in December 2008. Thirteen industries reported higher new orders, while four reported a decline in new orders.
Employment Sub-Index
With unemployment at 9.0% in December, and expected to remain there or even tick up a bit when the employment report comes out on Friday, the employment sub-index is of particular interest. The employment index rose to 64.5 from 61.7 in January. The employment sub-index has been above 50 for 17 straight months now.
Eleven industries reported an increase in employment while only two reported declines. The last time the employment sub-index was this high was way back in January 1973. That’s right folks — the last time the employment sub-index was this good, Richard Nixon was still enjoying his presidency.
However, it is worth noting that the employment index has been strong for awhile now, but we have not seen it being piced up in the official BLS statistics. The graph below shows the history of the key New Orders, Production and Employment sub-indexes since 1970.
Prices Paid Index
The prices paid index rose 0.5 points, and remains at the highest overall level, at 82.0, of any of the sub-indexes. This is a very clear indication that deflation is not around the corner, as some of the other price indexes like the CPI have seemed to be indicating.
Most of the prices paid in this index though tend to be commodities, not final goods. Still, the high prices paid sub-index is ammunition for those who are critical of Federal Reserve’s quantitative easing program.
The general rule on the sub-indexes is the higher they are the better, but this sort of level is a bit worrisome, and could raise fears of overheating. However, given the rest of the data out there, I’m not terribly concerned about that. Even though the level is very high, we were higher on this sub-index as recently as July of 2008.
It is worth noting that while most of the sub-indexes tend to fluctuate around the 50 level, the prices index tends to be much higher over time. Its average reading since 1948 is 62.5. Thus, while it is running high, it is not quite as high as if any of the other indexes had a reading of 82.0.
Foreign Trade
The ISM index also gives a bit of a glimpse into the foreign trade situation. It seems to be indicating an improvement in the trade deficit. The index tracking new export orders rose 0.5 points to 62.5 while the index tracking imports rose was unchanged at 55.0. However, the import figure only refers to imports of materials or components that domestic manufacturers use, not to finished goods.
Still, the figures seem to point to a further improvement in the trade deficit and net exports. Net exports were a huge boost to GDP growth in the fourth quarter, adding 3.35 points from growth. In other words, if the trade situation had remained unchanged from the third quarter, GDP growth would have been negative in the fourth quarter, not +2.8%. Thus, this sign of further potential strength in net exports bodes well for GDP growth in the first quarter.
Report Card: A+
Overall this was an outstanding report. It was better than the consensus expectation, and the overall level is consistent with an economic boom in the making, not a return to recession. It is at highs that have rarely been seen over the last 30 years.
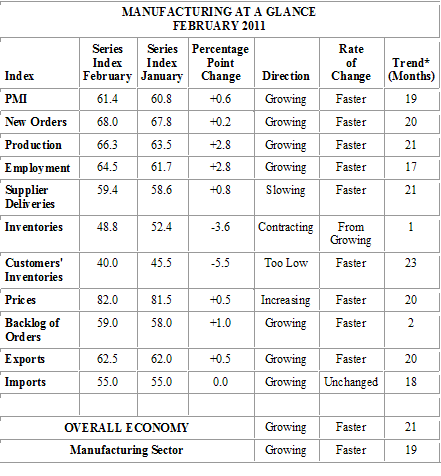
Three of the four sub-indexes that I consider to be most important — Production, New Orders and Employment — are not just above 50, but above 60. The fourth, Order Backlog, is not that far off the pace at 59.0, and had the biggest increase of any of the sub-indexes. The table below is from the ISM report and provides the summary information.


Leave a Reply