In December, home prices continued to slip, and the declines were very widespread. The Case-Schiller Composite 10 City index (C-10) fell 0.36% on a seasonally adjusted basis, and is down 1.22% from a year ago. The broader Composite 20 City index (which includes the cities in the C-10) fell by 0.41% on the month and is down 2.40% from a year ago.
This is the second month in this second leg down in housing prices that the year-over-year change has been negative for both composites; it will not be the last. Of the 20 cities, only six posted gains on the month. The biggest gains were in DC, up 1.14% on the month, followed by Dallas, up 0.80% and Boston, up 0.61%.
There were 14 metropolitan areas where prices fell on the month. Worst hit were Tampa and Detroit, each suffering a 2.14% decline on the month. They were followed by Phoenix, down 1.03%, Seattle (down 0.95%) and Portland (down 0.62%). Year over year, just two metro areas saw gains and 18 suffered losses. This is the six straight month-to-month decline in the composites. It thus looks like a new downtrend in housing prices is well established.
Look at Seasonally Adjusted Numbers
There is a seasonal pattern to home prices, and thus it is better to look at the seasonally adjusted numbers than the unadjusted numbers. Most of the press makes the mistake of focusing on the unadjusted numbers. While the 2.40% fall in the C-20 year over year in isolation is not the end of the world, it means that most of the small rebound in housing prices we saw from the spring of 2009 to the summer of 2010 has now evaporated.
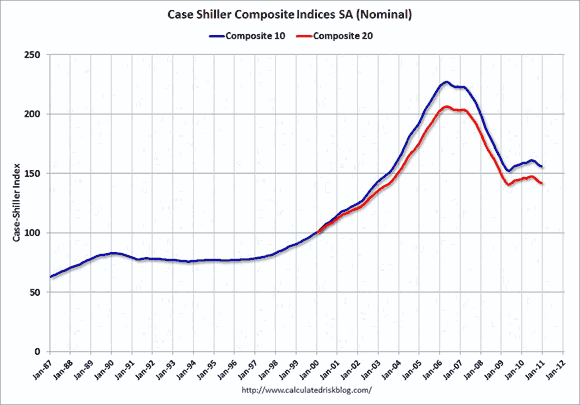
Eleven cities posted new post peak lows, meaning that the first-time homebuyer bounce in prices has now more than totally evaporated in those areas. From the April 2006 peak of the housing market, the C-10 is down 31.25% while the C-20 is off by 31.17%. Relative to the low of April 2009, the C-10 is now up just 2.43%, and the C-20 has only a 0.80% margin before it is posting new post bubble lows.
The Case Schiller data is the gold standard for housing price information, but it comes with a very significant lag. This is December data we are talking about, after all, and it is actually a three-month moving average, so it still includes data from October and November.
The second leg in the housing price downturn is not over. Housing prices are going to fall again in coming months. The first graph from (http://www.calculatedriskblog.com) tracks the history of the C-10 and C-20 indexes. Note that on both indexes we are almost back to the post-crash lows. It seems likely to me that we will set new lows before the second leg down is over.
Which Cities Fared Best/Worst?
On a year-over-year basis, with the exception of Washington DC (up 4.11%), the strongest cities are in California. However, even there the year-over-year gains are pretty much gone. San Diego is still in positive territory with a 1.70% rise. However, Los Angeles has fallen back into negative territory with a decline of 0.26%, and San Francisco is down 0.43%. Still, the only other city to hold its year-over-year decline to less than one percent was Boston, down 0.82%.
There were eight metropolitan areas where the year-over-year declines were more than 5%. Detroit fared the worst with a 9.15% decline (you can still have big percentage declines even as one approaches zero). The same is true for Phoenix, down 8.38% over the last year and showing no signs at all of rising from the ashes.
Atlanta has been hit almost as hard as if “Uncle Billy Sherman” was paying another visit to the city, down 8.00%. Portland is down 7.83%, and Chicago, facing an ill wind, it is down another 7.40% from a year ago. In other words, significant year-over-year declines are happening in just about every corner of the country.
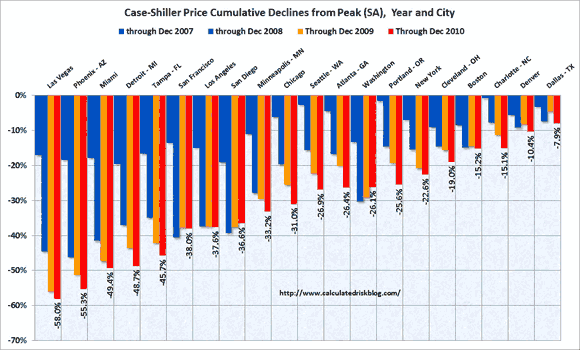
The graph (also from this source) below tracks the cumulative declines for each city over time. If the red bar is shorter to the downside than the yellow bar for a city, it indicates that prices in that city rose during 2010.
In every city, prices are below where they were in April 2006, but there is a huge variation. Las Vegas is the hardest hit, with prices down 58.04% from the peak, followed by Phoenix down 55.20%. Three more cities are down more than 40%: Miami down 49.01%, Detroit off 48.16%, and Tampa with a 45.45% decline.
At the other end of the spectrum are Dallas, where prices are down only 6.11%, Charlotte off 8.48% and Denver where they are down 10.02%. (Note: the percentage declines I am quoting are from April 2006, when the national peak was hit; the numbers in the graph are relative to that city’s individual peak, so there is a little bit of difference.)
Homebuyer Credits Long Gone
The homebuyer tax credit was propping up home prices, but now with that support gone, prices are resuming their downtrend. People had until June 30 to close on their houses, and they had to agree to the transaction by April 30. That pulled sales into those months that might otherwise have happened later on. The credit was up to $8,000, so almost nobody would want to close their deal in early July and simply leave that money on the table.
The tax credit is a textbook example of a third party subsidizing a transaction. When that happens, both the buyer and the seller will get some of the benefit. The buyer gets his when he files his tax return next year, the seller gets hers in the form of a higher price for the house.
Since the tax credit is now over, that artificial prop to housing prices has been taken away. Sales of existing houses simply collapsed in July, after the credit expired, and have remained depressed ever since. The extremely high ratio of homes for sale to the current selling pace is sure to put significant downward pressure on prices.
There is still quite a bit of “shadow inventory” out there as well. That is, homes where the owner is extremely delinquent in his mortgage payments and unlikely ever to make up the difference, but that the bank has not yet foreclosed on or foreclosed houses that have not yet been listed for sale.
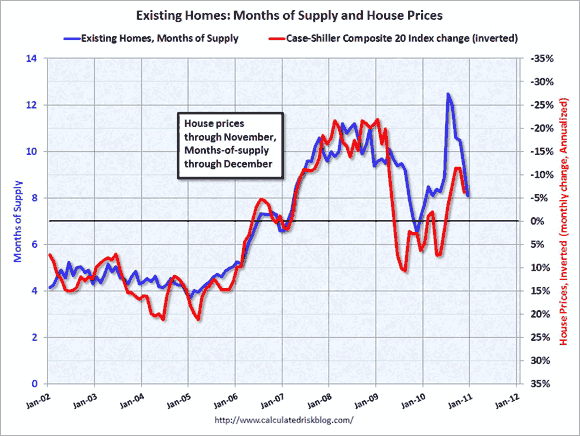
Take a good hard look at the third graph (also from this source) and tell me what you think is going to happen to housing prices over the next few months. A normal market has about six months of supply available; during the bubble, the months of supply generally ran closer to four months, and prices were soaring. It was not until inventories climbed above the six month mark that prices started to fall. The really collapsed as the months of supply moved into the double digits.
The extensive government support for the housing market — including the tax credit, but also the Fed buying up $1.25 Trillion in mortgage paper to artificially depress mortgage rates — helped boost sales and bring the months of supply back down. Now that support is over, the months of supply are still elevated, and thus housing prices are falling. Unfortunately this graph is not updated with the December price data, and we will not get the months of supply data for existing homes until tomorrow.
The tax credit was not a very effective means of stimulus, but it did help prop up prices, and that is a pretty important accomplishment, even if it proves to be ephemeral. The credit cost the government about $30 billion. A large part of that money went to people who would have bought anyways, but perhaps would have done so in July or August rather than May or June.
New Homes = Big Stimulus
To the extent it rewarded people for doing what they would have done anyway, it did nothing to stimulate the economy. Also, turnover of existing houses really does not do a lot to improve the economy. It is the building of new houses that generates economic activity.
It is not just about the profits of D.R. Horton (DHI). A used house being sold does not generate more sales of lumber by International Paper (IP) or any of the building products produced by Berkshire Hathaway (BRK.B) or Masco (MAS). It does not put carpenters and roofers to work. New homes do.
While housing prices are important to the economy, the level of turnover in used houses is not. Home equity is, or at least was, the most important store of wealth for the vast majority of families.
The Current State of Home Equity
Houses are generally a very leveraged asset — much more so than stocks. Using your full margin in the stock market still means you are putting 50% down. In housing, putting 20% down is considered conservative, and during the bubble was considered hopelessly old fashioned. As a result, as housing prices declined, wealth declined by a lot more. For the most part we are not talking vast fortunes here, but rather the sort of wealth that was going to finance the kids college educations and a comfortable retirement.
With that wealth gone, people have to put away more of their income to rebuild their savings if they still want to be able to send the kids to college or to retire. The decline in housing wealth is a very big reason why retail sales have been so weak. With everyone trying to save, aggregate demand from the private sector is way down. If customers are not going to spend and buy products, employers have no reason to invest to expand capacity. They have no reason to hire more workers.
Also, as housing prices fell, millions of homeowners found themselves owing more on their houses than the houses were worth. That greatly increases the risk of foreclosure. If the house is worth more than the mortgage, the rate of foreclosure should be zero. Regardless of how bad your cash flow situation is — due to job loss, divorce or health problems, for example — you would always be better off selling the house and getting something, even if it is less than you paid for the house than letting the bank take it and get nothing.
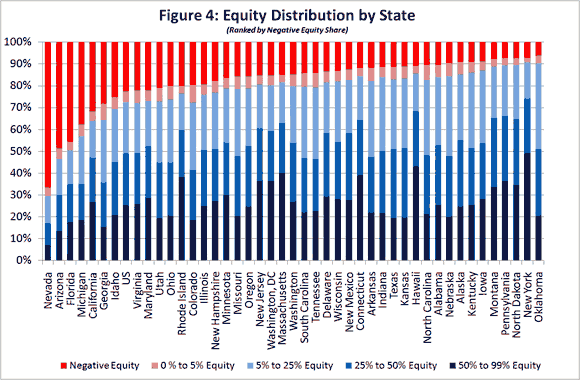
By propping up the price of houses, the tax credit did help slow the increase in the rate of foreclosures. Still, a quarter of all houses with mortgages are worth less than the value of the mortgage today. Another five percent or so are worth less than five percent more than the value of the mortgage. If prices start to fall again, those folks well be pushed under water as well.
The final graph below (from this source) shows where the underwater people are by state. Red means houses underwater, medium and dark blue indicate people with solid equity stakes in their homes.
On the other hand, it is not obvious that propping up the prices of an asset class is really something that the government should be doing. After all, it is hurting those who don’t have homes and would like to buy one.
Support for housing goes far beyond just the tax credit. The biggest single support is the deductibility of mortgage interest from taxes. Since homeowners are generally wealthier and have higher incomes than those who rent, this is a case of the lower middle class subsidizing the upper middle class. Also, even if they are homeowners, people with lower incomes are more likely to take the standard deduction rather than itemize their taxes. The mortgage interest deduction only applies if you itemize.
There has been much discussion of trying to rationalize the tax system and bringing down tax rates, but to do so the base would have to be broadened through the elimination of deductions. The mortgage interest deduction is one of the biggest of these. An attempt that leaves the mortgage interest deduction in place would have to be mere tinkering around the edges. While the concept of lower rates and fewer deductions is a good one, transitioning from here to there in the current weak housing market is going to be difficult to say the least.
The real problem though is that, now that the tax credit is over, prices will find their more natural level. Fortunately, relative to the level of incomes and to the level of rents, housing prices are now in line with their long-term historical averages, not way above them as they were last year.
In other words, houses are fairly priced — not exactly cheap by historical standards, but not way overvalued either. That will probably limit how much price fall over the next six months to a year to about 5% more from here, rather than the 30% decline we saw from the top of the bubble. That, however, is more than enough of a decline to do some serious damage.
A Weak Report, but Not Unexpected
The Case Schiller report was weak, but in line with what the consensus expected. The second leg down in housing prices is underway, but fortunately will probably be a much shorter leg than the first one.
Still, that is bad news for the economy. Used homes make very good substitutes for new homes, and with a massive glut of used homes on the market, there is little or no reason to build any new ones. Residential investment is normally the main locomotive that pulls the economy out of recessions. It is derailed this time around and there seems to be little the government can do to get it back on track.
MASCO (MAS): Free Stock Analysis Report
Disclaimer: This page contains affiliate links. If you choose to make a purchase after clicking a link, we may receive a commission at no additional cost to you. Thank you for your support!


Leave a Reply